Machine Learning in RapidMiner
Machine Learning in RapidMiner
- Last Updated: December 2, 2024
DataArt
- Last Updated: December 2, 2024

Currently the top three programs in automated and simplified machine learning are DataRobot, RapidMiner, and BigMl. In this article, we will take a closer look at RapidMiner, and tell you what it does and how it can make life easier for you.
RapidMiner
It is critically important for any business to evaluate the “work force” indicator within certain time periods. This allows you to plan business projects, which are always largely based on human resources. One risk factor may be seasonal outbursts of colds, when every year in winter a significant number of employees are on sick leave. As a result, the project deadlines shift, and any company would surely like to avoid such shifts. Machine learning can help with this.
With the help of RapidMiner we will analyze data on colds and build a model capable of predicting disease outbreaks. Based on the results of the forecast, the company will be able to take measures in advance and avoid losses.
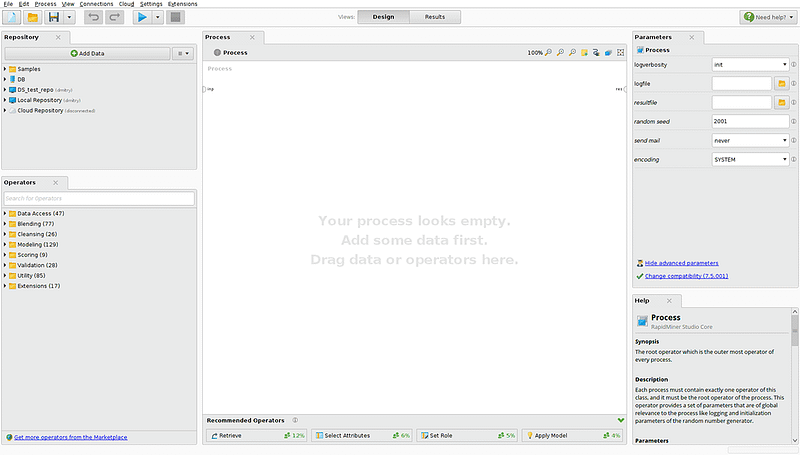
Image Credit: DataArt
On the left side of the screen you can see a data loading panel and an operator panel. RadpidMiner provides the ability to download data from the database or a cloud storage (Amazon S3, Azure Blob, Dropbox). The set of operators is divided into the following categories for convenience:
- Access to data (working with files, databases, cloud storage, Twitter streams)
- Operators for working with the attributes of data sets: conversion of types, dates, operations on sets, etc.
- Mathematica modeling operators: forecast models, cluster analysis models, optimization models.
- Additional help operators: Java and Groovy subroutines launcher, data anonymizer, email sender, and event scheduler
We described some of the main categories, each having its own subcategories and variations of the operators. It is worth paying attention to the possibility of adding operators from the ever-growing RapidMiner Marketplace. For example, among available extensions, there is an operator that allows you to convert datasets into time series.
In the central part of the screen you can find a working area for creating data conversion processes. Using drag and drop, we add data to the process with which we will work, data transformation, modeling, and so on. By specifying the relationships between data and operators, we dictate the vector of the process execution. In the bottom center you can find a panel with tips. Based on the processes built by other users, it advises you which operation to produce next. On the right there is a panel with the parameters of the selected operation and detailed documentation of the parameters and principles of operation.
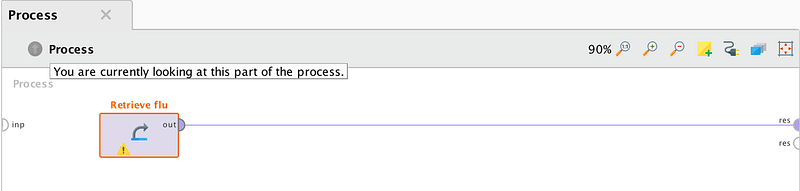
First, let us load the data on the number of Ukrainian search queries in Google related to the common flu.
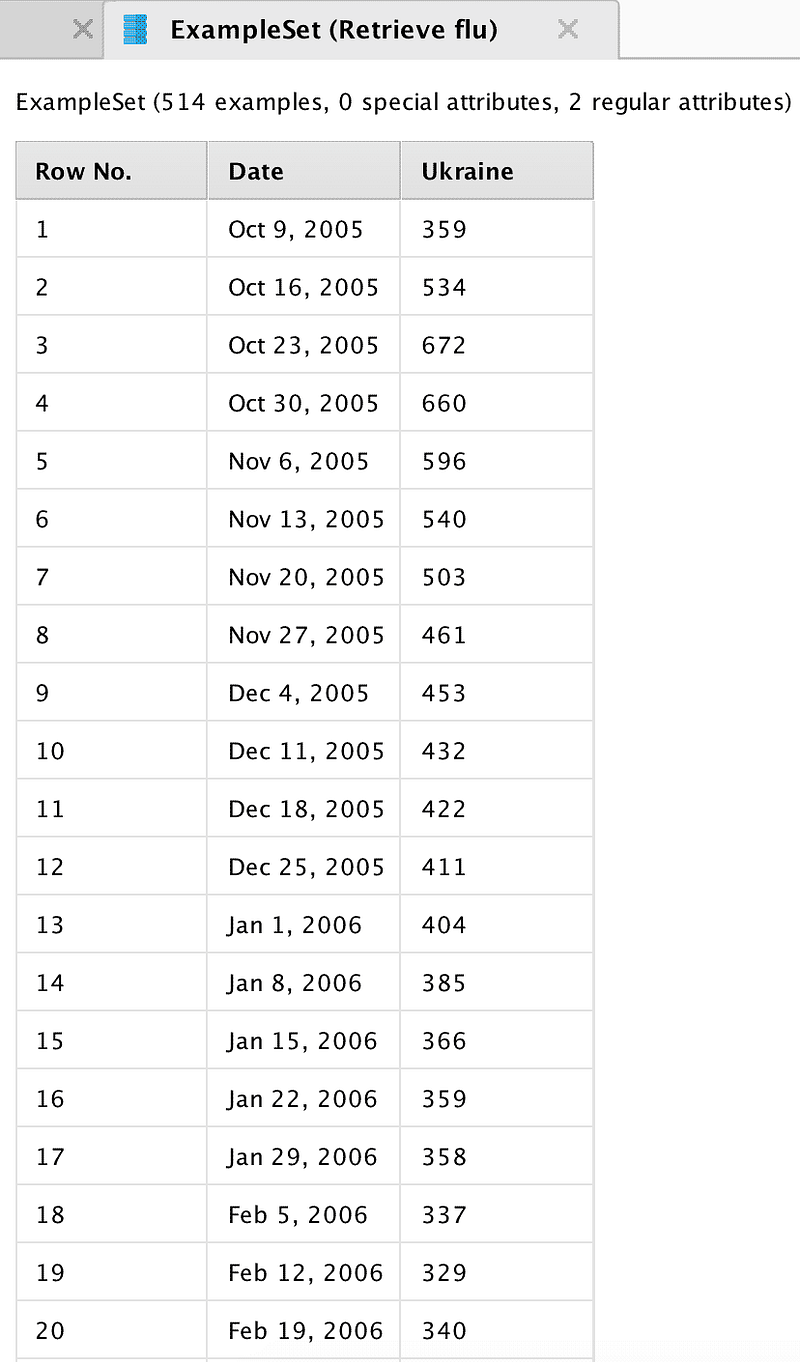
Image Credit: DataArt
Data represent the number of requests for the end of weeks from 2005 to 2015. When importing data, you must specify the date format for the correct construction of temporary charts. Let us connect the output of the data block to the output point of the process results (res). After clicking on the “start” button, the program will show the total statistics.
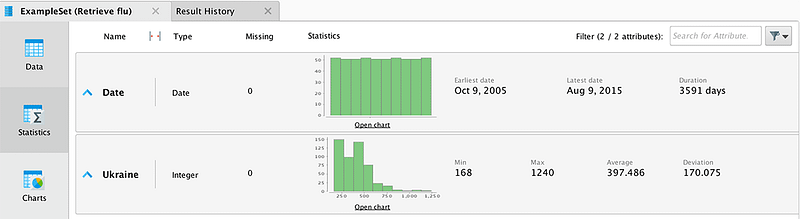
Using the Charts tab, let us make a data distribution graph (Pic 5). The graph reflects the apparent periodicity of catching the flu: the first wave begins in autumn, and the peak can be observed in February. Now let us take data for Russia and see if the same periodicity persists in them and whether the outbreak coincides with the periods that we have identified in Ukraine. To do this, load new data and merge them with the previously downloaded data. Merging should be done in the Date field with the help of the “Join” operator.

Image Credit: DataArt
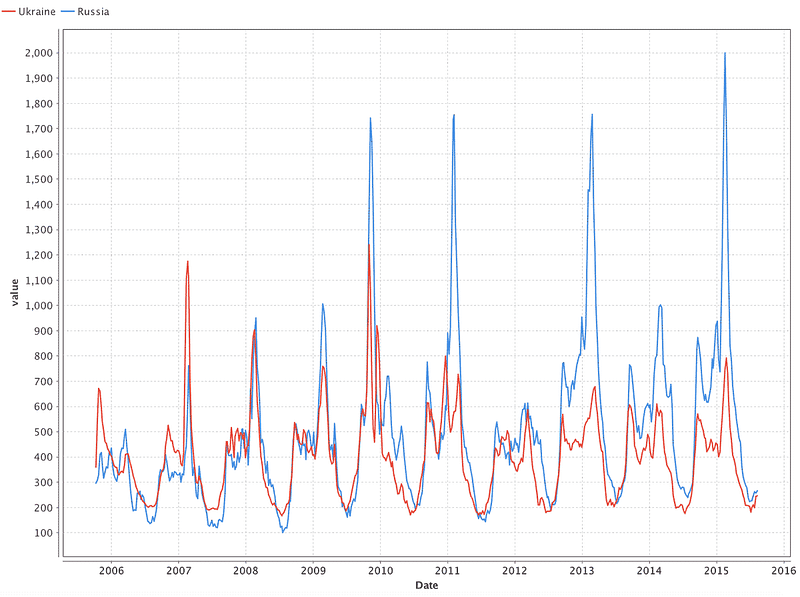
Image Credit: DataArt
Building a Model
Now let us discuss the construction of a model that will predict the number of cases in Ukraine. We are going to predict the value of the series for the following week based on the values of the previous four weeks (approximately one month). In this article, we use a neural network of direct propagation to predict the time series. The choice of neural networks is justified by the simplicity of selecting the model parameters and their further use. Unlike autoregressive and moving average models, neural networks do not require any time series correlation analysis.
The scheme of the process allows you to predict the values of the time series.
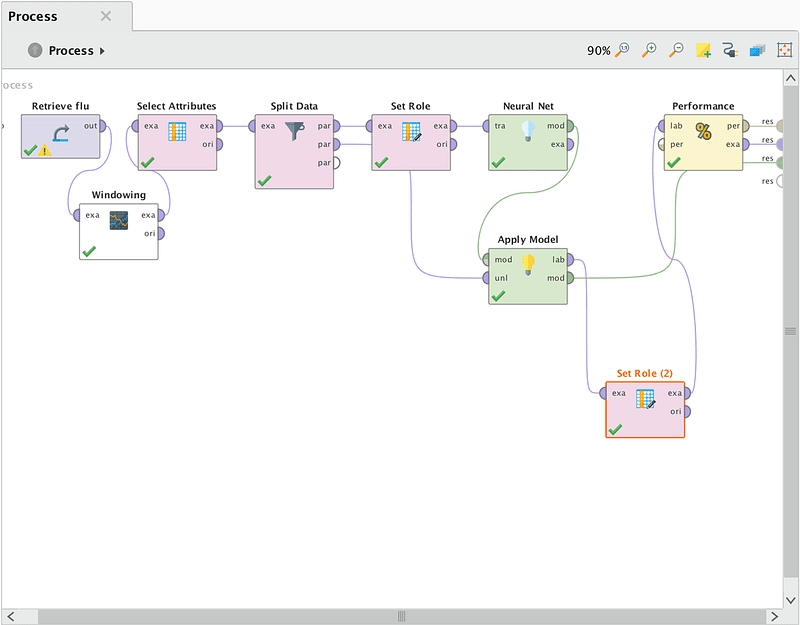
Image Credit: DataArt
For a neural network operator to work correctly, it is necessary to convert the original time series into a training sample format. To do this, we used the Windowing operator from the Series Extension package. Thus, from the column of values we have obtained the table of the following format:
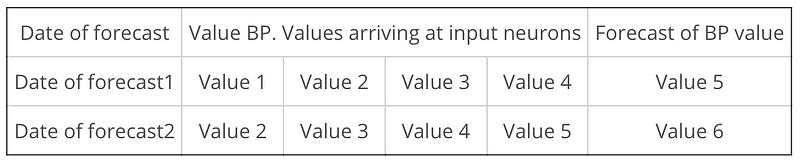
Image Credit: DataArt
Then, using the “Select Attributes” operator, we removed extra fields from the sample (dates for values 1–4). Teaching a neural network by a coach requires training and a test sample, so with the help of the “Split Data” operator we divided BP in the proportion of 80 to 20.
According to the documentation of the “Neural Net” operator, it is necessary that the column of predicted values in the training sample should have the name/role “Label”, for which the “Set Role” operator was used. Since the “forecast date” column does not participate in the forecasting, it needs to be assigned the “ID” role. We must connect the second output of the “Split Data” operator and the output “mod” of the operator “Neural Net” to the corresponding “ApplyModel” inputs. The “Apply Model” operator applies a control sample to the input of the trained model and compares the predicted and real values.
The final stage of our process is the “Performance” operator, which is necessary for determining the result errors. The predicted value obtained from the “Apply model” with “Set Role (2)” was assigned the “Prediction” role.
Let us consider the parameters used by the operators of the neural network and the errors in the calculations. By trial, we arrived at the architecture of the neural network depicted in Pic 8. The deep feed forward neural network has 2 hidden layers: 4 neurons in the first one and 12 in the second. The sigmoid was used as the activation function. The training was conducted on normalized input data with a learning factor of 0.5 and a number of cycles of 1500.
Forecasting Results
As a result of operating our model, RapidMiner provides three artifacts:
- Model: Its graphical representation, parameters and weights vectors
- The results of the calculated errors
- Sampling of test data, supplemented with a column of predicted values
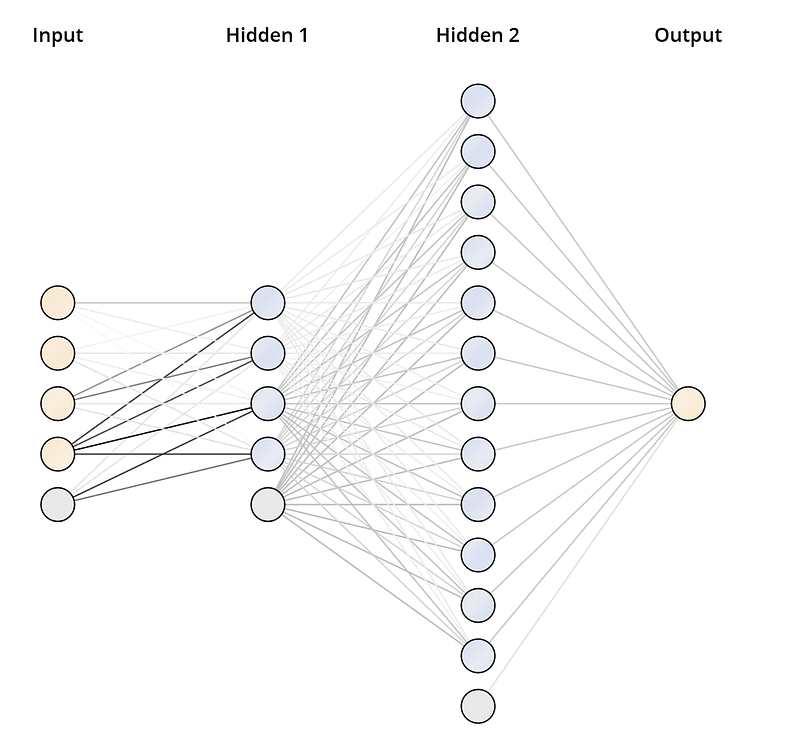
Image Credit: DataArt
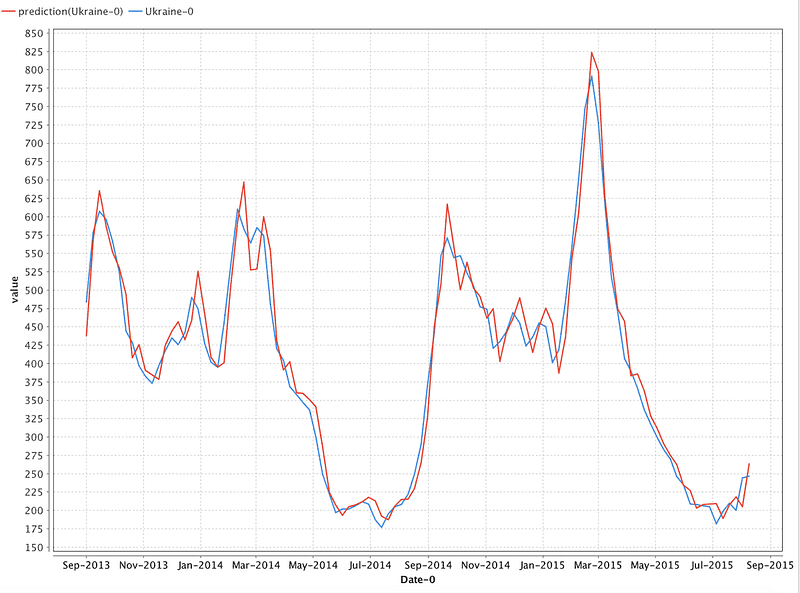
Image Credit: DataArt
As you can see, the chart with predicted data is very close to real data. We estimate the results of the constructed model by calculating the forecast error using the next formulas:
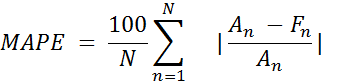
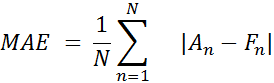
Where An is a real value and Fn is a predicted value.
As a result, we get this:
MAPE = 5.47%
MAE = 21.748
Conclusion
Massive implementation of machine learning technologies entailed creation of tools of varying degrees of complexity for end users. The RapidMiner program introduced in the article reduces the entry threshold for the study of Machine Learning technologies.
If you use this program, you do not need to be able to write code in Python or R. RapidMiner constantly advises you on the next step in the data preparation chain, model training, validation, and accuracy assessment. It allows you to automatically correct some errors in the process. It can help and explain the individual moments you might have missed previously.
While writing this article, we studied the functionality of RapidMiner. It is quite extensive and provides the ability to apply complex architectures of neural networks and fine-tune their parameters (the choice of the activation function, the configuration of neural links of hidden layers, etc.).
The license allows users to perform calculations in the RapidMiner cloud, which should shorten the training time and speed up the process of other characteristics. In addition, the license allows you to download more data and does not limit users to ten thousand lines.
The mathematical model constructed in the article has reached the margin of error of about 6% on test data and with some changes it can be used to predict growth of the flu. However, our main goal was to show the simplicity of the RapidMiner program used.
By using RapidMiner and any similar approach, any company can predict situations similar to flu outbreaks. Preventive measures taken based on the forecast allow us to reduce risks and ultimately increase profits.
Written by a collaboration of DataArt's IoT Team: Dmitry Sobolev, Senior Developer; Igor Masternoy, Senior Developer; and Rafael Zubairov, Project Manager.
The Most Comprehensive IoT Newsletter for Enterprises
Showcasing the highest-quality content, resources, news, and insights from the world of the Internet of Things. Subscribe to remain informed and up-to-date.
New Podcast Episode

The State of Smart Buildings
Related Articles


Related Solutions

Retail Shelf Utilization Monitoring
Improve inventory management, boost revenue, optimize staff efficiency, and enhance customer experience.
Improve inventory management, boost revenue, optimize staff efficiency, and enhance customer experience.
Leverege
Leverege

Bottom of Basket for Grocery Stores
Enables grocery stores to automatically detect bottom cart items, alert cashiers and help reduce shrinkage
Enables grocery stores to automatically detect bottom cart items, alert cashiers and help reduce shrinkage
Leverege
Leverege

Service Intelligence for Auto Service Providers
Gain insights into bay utilization, crew performance, and improve customer satisfaction
Gain insights into bay utilization, crew performance, and improve customer satisfaction
Leverege
Leverege
Related Solutions
Retail
Retail Shelf Utilization Monitoring
Improve inventory management, boost revenue, optimize staff efficiency, and enhance customer experience.
Leverege
Retail
Bottom of Basket for Grocery Stores
Enables grocery stores to automatically detect bottom cart items, alert cashiers and help reduce shrinkage
Leverege
Automotive
Service Intelligence for Auto Service Providers
Gain insights into bay utilization, crew performance, and improve customer satisfaction
Leverege