A Practical Guide to Monitoring & Observability of IoT Devices
A Practical Guide to Monitoring & Observability of IoT Devices
- Last Updated: December 2, 2024
Spotflow
- Last Updated: December 2, 2024

Monitoring and observability are vital for maintaining IoT device reliability, efficiency, and security. When done right, they offer a real-time overview of your IoT systems but also ensure access to data necessary for troubleshooting historical issues. Yet, when confronted with the thousands of diverse IoT devices, achieving these objectives brings many challenges.

Should I Monitor or Should I Observe?
First, let’s revise the terminology in IoT monitoring and observability as the words "monitoring" and "observability" are often used interchangeably despite their differences.
Let's start with monitoring, a term with a more established history. At its core, monitoring aims to offer insights into the health and performance of a system.
This begins by gathering and analyzing relevant metrics. The analysis is typically presented through dashboards. However, a reasonable monitoring stack should go beyond visual representation, evaluating the metrics in real-time and alerting users to any anomalies or issues.
But there is a catch with the traditional approach to monitoring: it requires you to know what to look for. This method may fall short when encountering novel problems.
This is where observability comes into play as it can help you handle the so-called unknown unknowns. Simply put, a system is observable when you can answer questions about its inner workings solely from its outputs. The usual outputs of the software include logs, metrics, and traces.
A system with good observability is not only easier to troubleshoot but also allows you to detect a much broader range of issues. This is because you have much better insights into the system, so it’s easier to get answers to your questions about what is actually happening.
Observability is especially important in the context of IoT, where the systems involve numerous devices and modules. Attempting to anticipate every potential combination of states that could lead to trouble is impractical at this scale, if not impossible.
Essential Metrics and Monitoring Approaches
Let's explore the data worth tracking and the specific instruments designed to help us with this task.
Are We Getting the Data?
It's no secret that the Internet of Things is often more about the data than the things. That's why keeping an eye on your devices' data transmission is crucial. A solid IoT platform should keep a close watch on metrics like message frequency and data volume transmitted.
Yet, manually watching the traffic of thousands of devices is obviously not a wise thing to do. The need for automatic alerting is unquestionable in this case. The very minimum that you should be alerted about is when the device is not sending any data, but you expect it to do so.
However, keep in mind that IoT devices often operate in unpredictable environments, such as areas with unreliable internet connections. So, a short gap in data transmission doesn't always indicate a problem with the device.
Also, it is a common practice to buffer the messages either on your device or an edge gateway, so you don't lose any important data. The point is that you must be very careful not to make your thresholds too sensitive. Otherwise, you'll be alerted about every hiccup in the network which inevitably leads to alert fatigue, and the alerting will lose its potential.
General Device Health Information
Monitoring device health involves tracking various key metrics. You can think of CPU, memory consumption, and network traffic. Having access to these metrics can help to identify performance problems, detect software bugs, or even reveal external attacks.
There are many ways how to expose these metrics. However, the engineering community is currently captivated by the capabilities of OpenTelemetry.
One of their main selling points is their vendor-agnostic approach. That is, you can choose from a great number of observability backends for the storage and the following analysis. This has led to all sorts of tools being made to work with it.
So, no matter what language or system you're using, you're covered. This is super handy, especially in the wild world of IoT where every device might be running its unique software.
OpenTelemetry supports three main types of signals: metrics, logs, and traces. For most cases outlined in this section, devices simply need to expose several relevant metrics, such as their current memory consumption.
Then, these metrics need to be transported into the cloud where you can visualize them, set up alerting, and so on. This path is already paved for the IoT use cases with projects like OpenTelemetry Collector or Telegraf that can help you collect metrics from your IoT devices.
Other Domain Specific Signals
Apart from the general characteristics of sending data and resource utilization, you may need to track some domain-specific values. This could involve sending logs, traces, or simple messages containing application-specific content.
For both the logs and traces, you can rely on the OpenTelemetry ecosystem once again. This allows you to analyze logs and traces using your preferred backends, such as Grafana Loki/Tempo or the Elastic Observability stack, without extra effort! Messaging is, on the other hand, the core functionality of every reasonable IoT platform. In other words, these approaches should be trivial to implement in most scenarios.
The Simplicity of Logs
Consider an autonomous harvester machine, for instance. You might want to track its activities. A simple way to do this is to send a log when the activity started with some additional metadata.
You can do the same thing when the activity finishes and for other relevant events. Essentially, each log record is just a structured event with several required properties. Below is an example of a log sent when the harvester starts its docking sequence:

Apart from the primary fields, like timestamp and body, the message may contain additional attributes describing the event in greater detail. These extra bits can be handy when you're hunting down bugs. So make sure to include all the important information.
The Deep Contextual Insights with Traces
If you want a bit more detailed insights, you can also employ tracing. A trace corresponds to one logical operation of a system, and it is implicitly defined by its spans. A span represents a single unit of work of that operation. It is defined by its start and end times, attributes, and optionally, a parent span.
Thanks to the parent references, the trace forms a directed graph describing the particular operation and its subroutines. Additionally, spans may contain multiple span events describing an event that happened at a specific point in time.
While traces are typically associated with monitoring distributed systems, it is also possible to use tracing in IoT devices to help you understand the big picture of what is happening in the field. Let’s say you're curious about how the autonomous harvester goes back to its docking station.
See the figure below, where the docking corresponds to the top-level root span. First, the harvester needs to locate the docking station, so it calls an API. This operation corresponds to one child span. An example of a span event may be the point when the harvester left the field. When using all the tracing instruments together, you can see the whole picture of the device's operation.

Back to Basics with Simple Messages
In certain scenarios, sending simple structured messages may be more practical than using the OpenTelemetry signals. Going back to the autonomous harvester example, you'd probably want to track its location.
If you wanted to visualize the location in real time, OpenTelemetry currently doesn't really support a signal that would semantically fit this scenario. The closest match would likely be their Event API, which is still in an experimental phase (at the time of writing this article in Q1 2024). Instead, consider sending the following JSON message:

Ideally, the IoT platform that you're using should be able to parse such messages and ingest them into the suitable database of your choice. From there, you're free to analyze and visualize the data according to your needs.
We've recreated this example with the Spotflow IoT platform to demonstrate the simplicity. We set up a device that periodically sends messages with its location and velocity to the platform. Then, we routed the data stream into our built-in Grafana egress sink. And that's it! The platform now grabs all the messages and puts them into a time-series database which can be queried in Grafana.
Also, this is a great use case for the Grafana Geomap visualization. It lets you easily plot the locations of your devices. See the image below, where we've used Grafana to visualize the data received from the device.

Key Takeaways
And that’s it! Now you’re ready to set up your observability stack and start monitoring your IoT devices. We’d like this article to serve as a starting point in the world of IoT observability. Remember the following key ideas:
- Monitor Data Transmission: Keep a close watch on data transmission from your devices and be prepared with alerts to catch any disruptions promptly.
- Track Device Health Metrics: Surface relevant metrics regarding your device's health to ensure smooth operations.
- Send Application Specific Data via Logs, Traces, and Structured Messages: Think about your domain and the device’s operation and send all the data that might be needed for future debugging and real-time monitoring.
- Explore OpenTelemetry Ecosystem: Consider using the OpenTelemetry ecosystem in IoT as it becomes an observability standard giving you many options for observability backends and serving various device runtimes.
The Most Comprehensive IoT Newsletter for Enterprises
Showcasing the highest-quality content, resources, news, and insights from the world of the Internet of Things. Subscribe to remain informed and up-to-date.
New Podcast Episode

IoT Is Finally Delivering
Related Articles


Related Solutions

Child Safety Badges for Large Venues
Smart badges enable instant reunification, proactive alerts, and a safer, more trusted guest experience.
Smart badges enable instant reunification, proactive alerts, and a safer, more trusted guest experience.
Iveda
Iveda
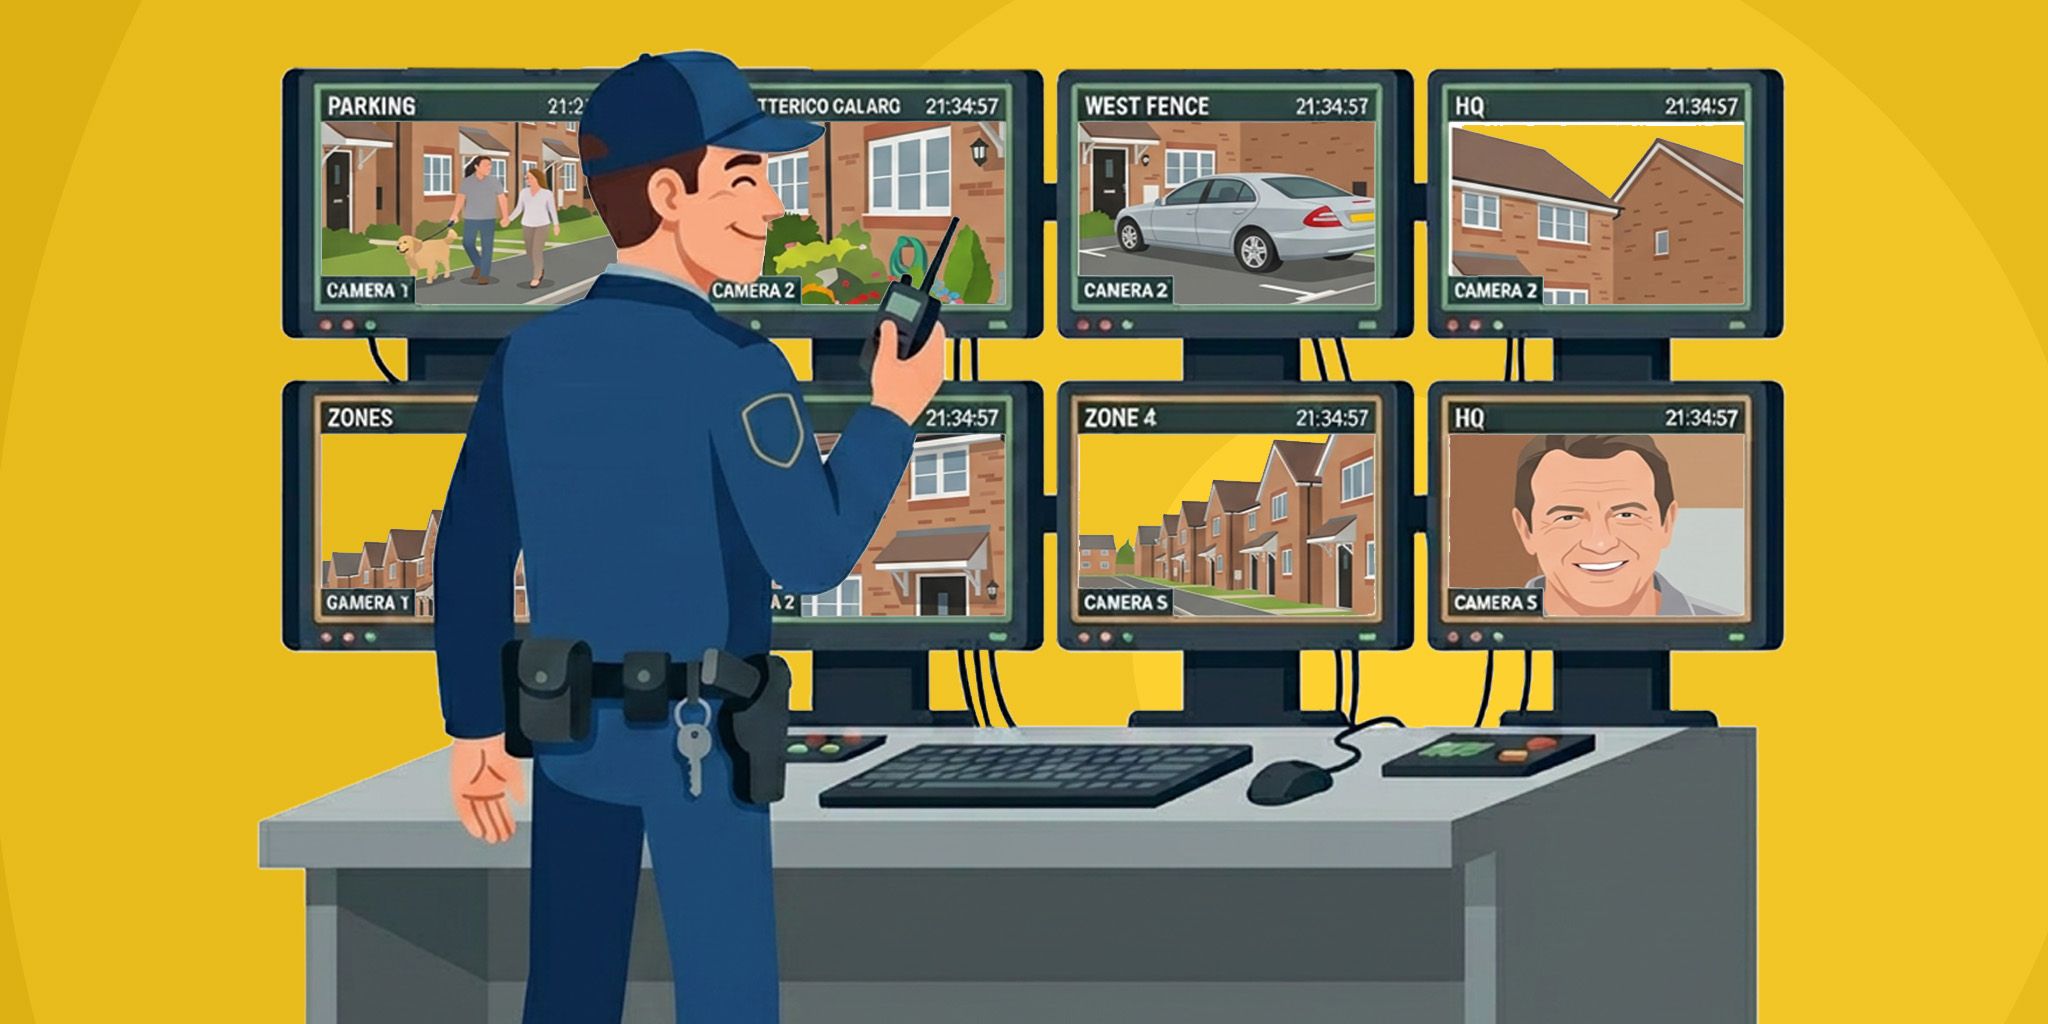
Smart Community Management for HOAs
AI-powered community monitoring with real-time visibility into entrances, parking, and shared spaces.
AI-powered community monitoring with real-time visibility into entrances, parking, and shared spaces.
Iveda
Iveda
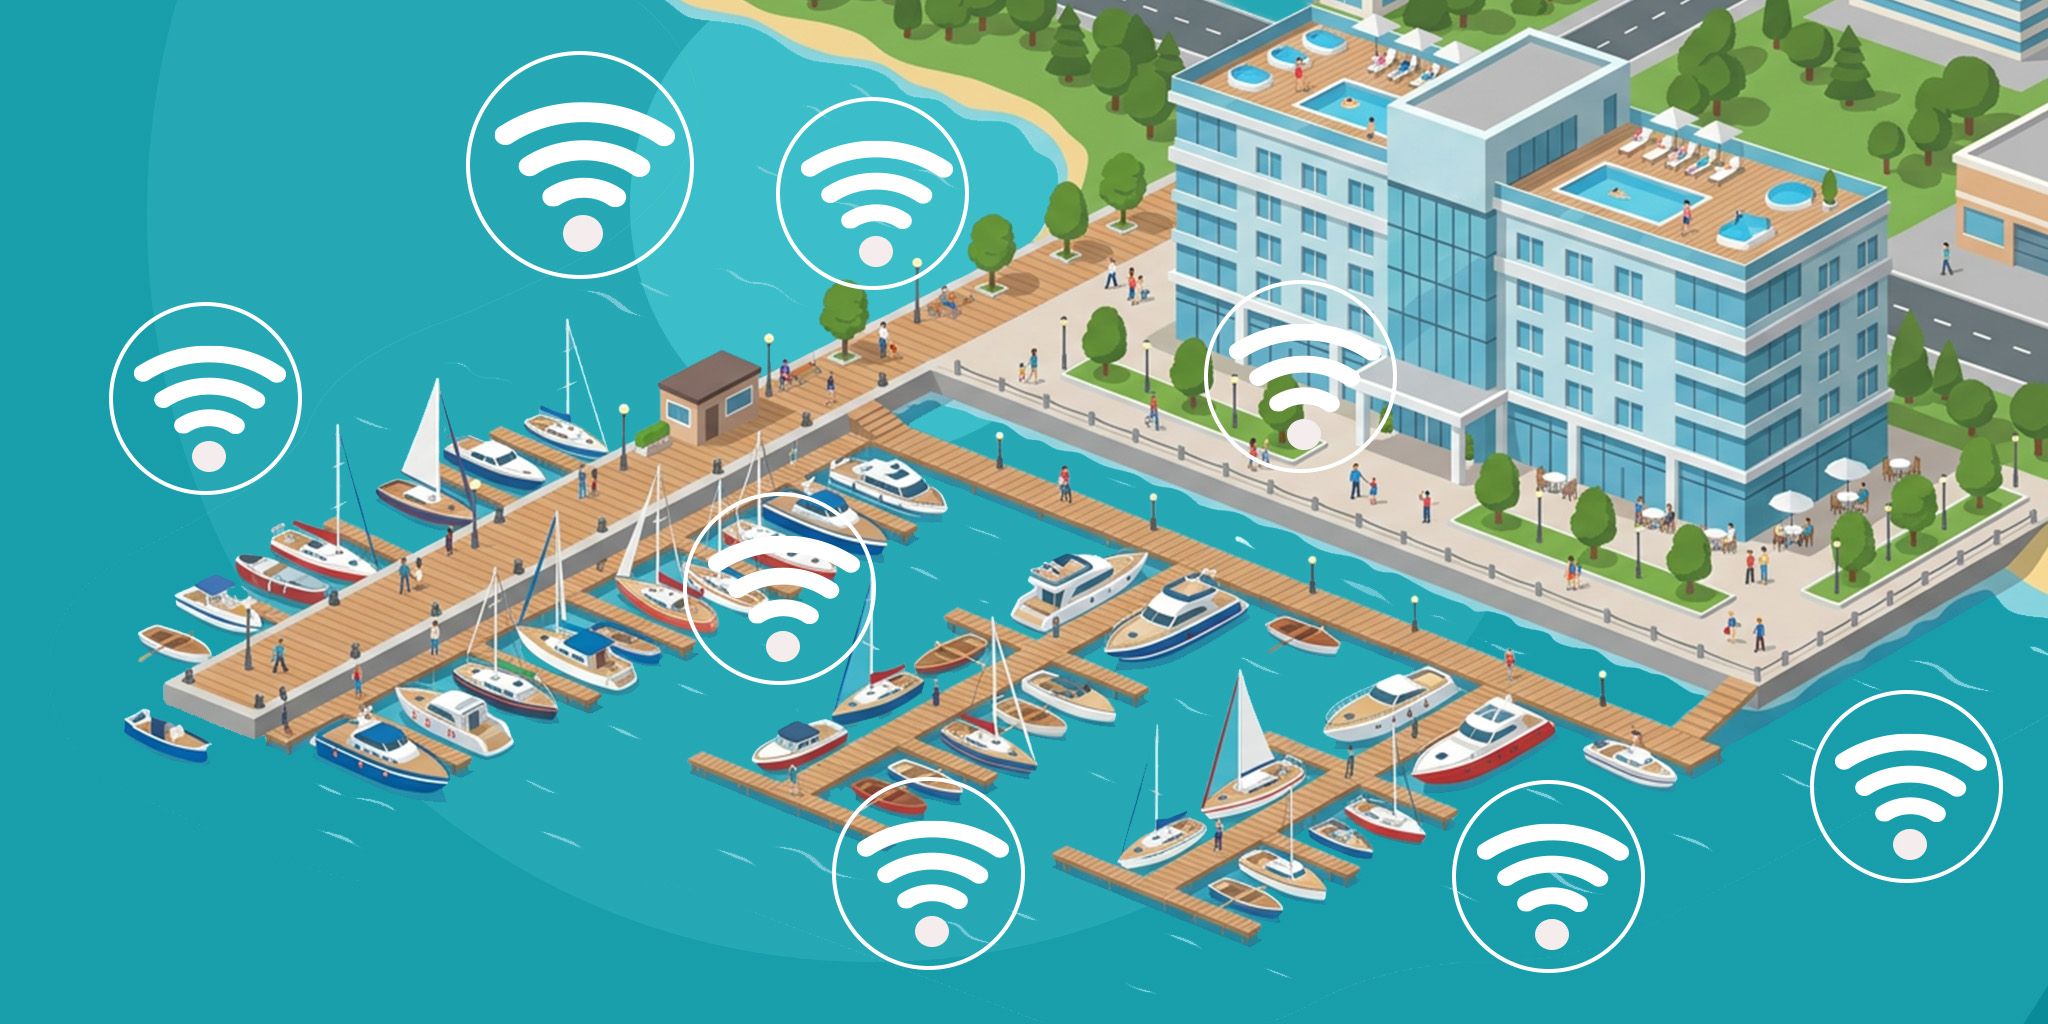
Smart Marina Management
Real-time visibility into marina assets, utilities, and security. Monitor, manage, and monetize marina resources more efficiently.
Real-time visibility into marina assets, utilities, and security. Monitor, manage, and monetize marina resources more efficiently.
Smarter Technologies
Smarter Technologies
Related Solutions
Buildings & Facilities
Child Safety Badges for Large Venues
Smart badges enable instant reunification, proactive alerts, and a safer, more trusted guest experience.
Iveda
Buildings & Facilities
Smart Community Management for HOAs
AI-powered community monitoring with real-time visibility into entrances, parking, and shared spaces.
Iveda
Maritime & Boating
Smart Marina Management
Real-time visibility into marina assets, utilities, and security. Monitor, manage, and monetize marina resources more efficiently.
Smarter Technologies