



Beyond Mobile Apps: Designing Shared IoT Dashboards for Commercial Buildings
Beyond Mobile Apps: Designing Shared IoT Dashboards for Commercial Buildings

- Last Updated: September 11, 2026
Sergey Eskin
- Last Updated: September 11, 2026

Many commercial IoT projects begin with sensors, gateways, and cloud platforms. The interface comes later. By the time it does, the easiest option is often to place every available metric and control on a web dashboard.
That approach may work for the engineering team that built the system. It often fails for the people who operate the building every day.
A facilities manager, receptionist, maintenance technician, security officer, and tenant do not need the same information. They may not carry the same company phone, have access to the same application, or even belong to the same organization. Yet they all interact with the same physical environment.
This is where a shared IoT dashboard becomes useful. A screen in a lobby, control room, reception area, meeting space, or service corridor can give people a common operational view. Designing that screen, however, requires a different approach from designing a personal mobile app.
Begin With Operational Decisions, Not Device Inventory
The first version of many dashboards mirrors the device database. It has a tile for each thermostat, light, air-quality sensor, access point, camera, and meter. The result is technically complete but operationally weak.
People rarely approach a building interface asking, “What is sensor 184 reporting?” They ask questions such as:
- Is any occupied room uncomfortable?
- Is an entrance unsecured?
- Which meeting spaces are available now?
- Is energy use outside the expected range?
- What needs attention before the next shift begins?
Start by listing the decisions each user must make. Then identify the minimum data required for those decisions. This reverses the usual hierarchy: operational exceptions come first, context comes second, and the full device inventory remains available for diagnosis.
For example, a facilities dashboard does not need to show 80 normal temperature readings at the same visual weight. It needs to show that two occupied zones are outside their target range, when the condition began, and whether the underlying equipment is responding.
Design for a Shared Environment
A personal application can assume that one authenticated person is holding the device. A shared screen cannot.
The people standing in front of it may have different roles and permissions. The display may also be visible to visitors. This makes access design part of the interface, not merely a backend concern.
A useful model separates information into three layers:
- Common operational context. Safe information that helps everyone understand the space, such as room availability, general comfort status, local weather, service notices, and the next scheduled activity.
- Role-based actions. Controls available after a staff member identifies themselves, such as changing a zone setpoint, acknowledging an alert, or placing equipment into maintenance mode.
- Restricted operations. Security, access control, camera management, and potentially destructive commands that require stronger authentication or a separate workstation.
This structure keeps the shared display useful without turning it into an exposed administrative console. It also reduces the temptation to solve every permission problem by removing useful information from the screen.
Treat Scheduling and Weather as Operational Data
IoT dashboards often give priority to live sensor values while treating schedules and weather as decoration. In commercial buildings, both can explain what should be happening.
A room temperature of 25°C means something different when the room is empty, when a meeting begins in ten minutes, and when a large event is underway. A shared schedule can provide that context. Meeting bookings, cleaning windows, deliveries, maintenance work, and tenant events can help operators distinguish a real problem from an expected transition.
Weather has a similar role. Outdoor temperature, wind, precipitation, and air quality affect HVAC demand, natural ventilation, solar generation, irrigation, loading operations, and visitor traffic. A weather panel becomes useful when it connects conditions to an operational decision.
Instead of showing only a forecast icon, the dashboard might indicate that unusually high cooling demand coincides with a heat warning, that irrigation can be delayed because rain is expected, or that an outdoor service task should be rescheduled because of high wind.
The goal is not to add more widgets. It is to explain the relationship between the building, its schedule, and external conditions.
Build an Exception Hierarchy
Not every alert deserves the same interruption. If everything is urgent, operators learn to ignore the screen.
An exception hierarchy should consider at least four factors:
- Safety: Could the condition affect people, security, or critical equipment?
- Operational impact: Is a space unavailable or a service disrupted?
- Time sensitivity: Must someone act now, during the current shift, or later?
- Confidence: Is the event supported by one reading or by several related signals?
The interface should make these differences visible. A critical access-control fault should not look like a mildly warm meeting room. An alert that has already been assigned should not compete with an unacknowledged incident. A recurring sensor anomaly should include enough history to help a technician decide whether the issue is real.
This hierarchy also supports better escalation. The shared display can provide awareness, while notifications and work-order systems handle ownership and follow-up.
Plan for Partial Failure
A building does not stop operating because a cloud API is unavailable. The dashboard should not become a blank screen either.
During design, decide what the interface will do when it loses:
- internet connectivity;
- access to the cloud platform;
- one gateway or building subsystem;
- current weather or scheduling data;
- permission to execute a command.
Stale data should be labeled with its last update time rather than presented as current. Unavailable controls should explain why they cannot be used. Locally available information should remain visible when possible. If a command is queued for later delivery, the interface must distinguish “requested” from “completed.”
These details build operator trust. A dashboard that honestly communicates uncertainty is more useful than one that appears healthy until somebody discovers that its data stopped updating hours ago.
Design for Distance and Short Interactions
A shared display is often viewed while someone is walking past it or standing several meters away. Dense tables and small labels that work on a laptop become unreadable in the physical environment.
The first screen should support a quick scan: overall state, important exceptions, current occupancy or schedule, and a small number of common actions. Detailed trends, device history, and configuration can sit one level deeper.
Input method matters too. A wall-mounted touchscreen, a screen operated with directional controls, and a control-room workstation require different layouts. Touch targets need space. Directional navigation needs a predictable focus order. A passive display should not require interaction to communicate its most important information.
The right question is not whether the dashboard fits on the screen. It is whether a person can understand it in the time and position in which it will actually be used.
Operate the Dashboard as Part of the IoT Fleet
Once shared screens are installed across multiple floors or sites, they become managed endpoints. Teams need a plan for configuration, software updates, health monitoring, and recovery.
Useful operational capabilities include:
- remotely reporting application and device health;
- assigning layouts by building, floor, or role;
- deploying updates in stages;
- restoring a known configuration after device replacement;
- identifying displays that are offline or showing stale data;
- auditing privileged actions taken from shared interfaces.
A prototype running on one tablet can be configured manually. A deployment of 200 screens cannot. Fleet operations should be considered before the interface becomes part of daily building workflows.
Measure Outcomes, Not Screen Activity
Page views and button presses say little about whether a shared dashboard is improving operations.
Better measures are tied to the decisions the screen is meant to support. These might include time to acknowledge a fault, repeated comfort complaints, unnecessary technician visits, meeting-room downtime, energy exceptions resolved during the same shift, or the number of routine questions handled without calling the facilities team.
Qualitative feedback matters as well. Watch how each role uses the display. If people repeatedly open a detailed device list to answer a basic operational question, that information probably belongs higher in the hierarchy. If an alert is always dismissed without action, its threshold or presentation may be wrong.
A Shared Screen Is an Operational Product
The most successful shared IoT dashboards are not miniature building-management systems and not enlarged mobile apps. They are focused operational products for a particular place and group of people.
They combine device state with the context needed to interpret it. They expose common information while protecting privileged controls. They remain honest during partial failure. They are readable at the distance where they are installed, and they can be managed as the deployment grows.
Connected buildings already generate more data than most operators can use. The opportunity is not to place all of it on another screen. It is to turn the right data into a common understanding of what is happening, what matters, and what someone should do next.

The Most Comprehensive IoT Newsletter for Enterprises
Showcasing the highest-quality content, resources, news, and insights from the world of the Internet of Things. Subscribe to remain informed and up-to-date.

New Podcast Episode

Building Real-Time Voice AI Experiences

Related Articles

Related Solutions

Child Safety Badges for Large Venues
Smart badges enable instant reunification, proactive alerts, and a safer, more trusted guest experience.
Smart badges enable instant reunification, proactive alerts, and a safer, more trusted guest experience.
Iveda
Iveda
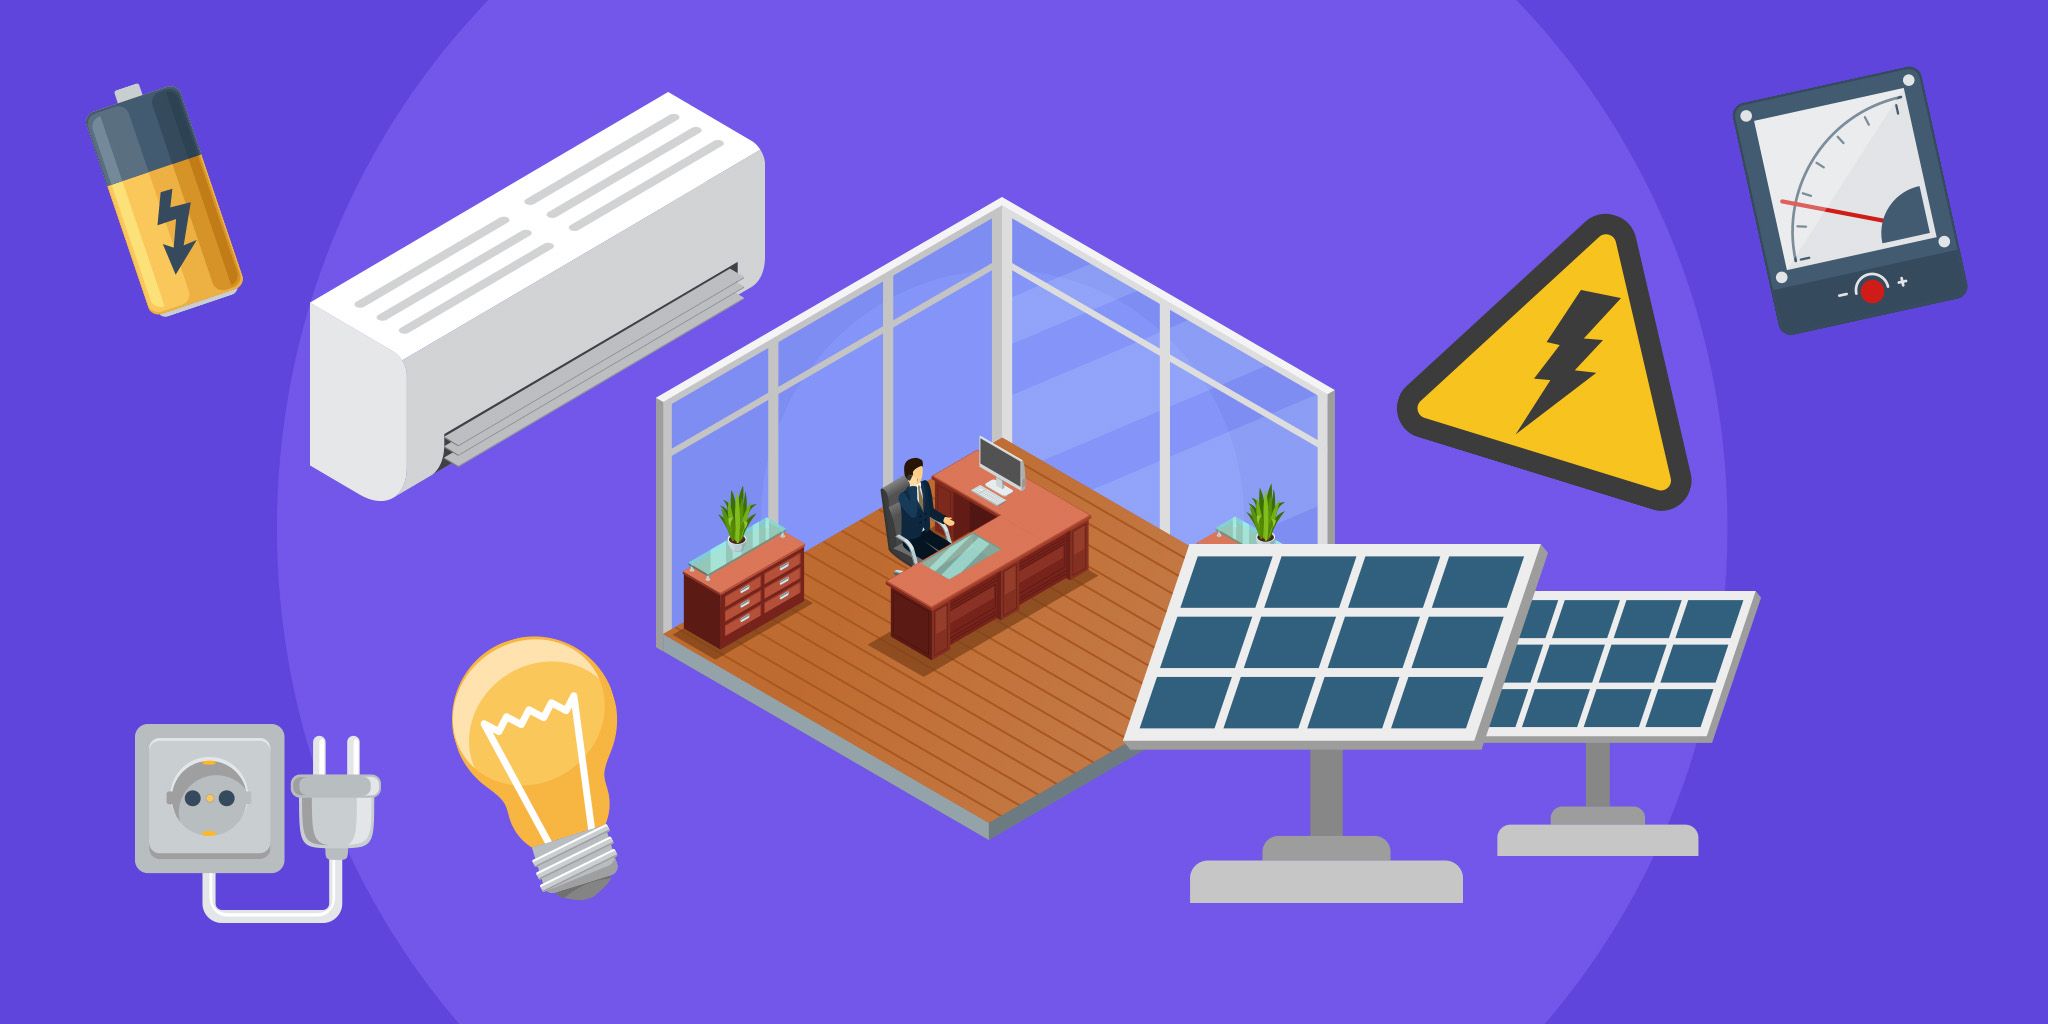
Energy Management for Smart Buildings
Gain visibility, cut energy waste, and enhance comfort with AI‑driven analytics for more sustainable and cost‑effective building operations.
Gain visibility, cut energy waste, and enhance comfort with AI‑driven analytics for more sustainable and cost‑effective building operations.
Milesight
Milesight

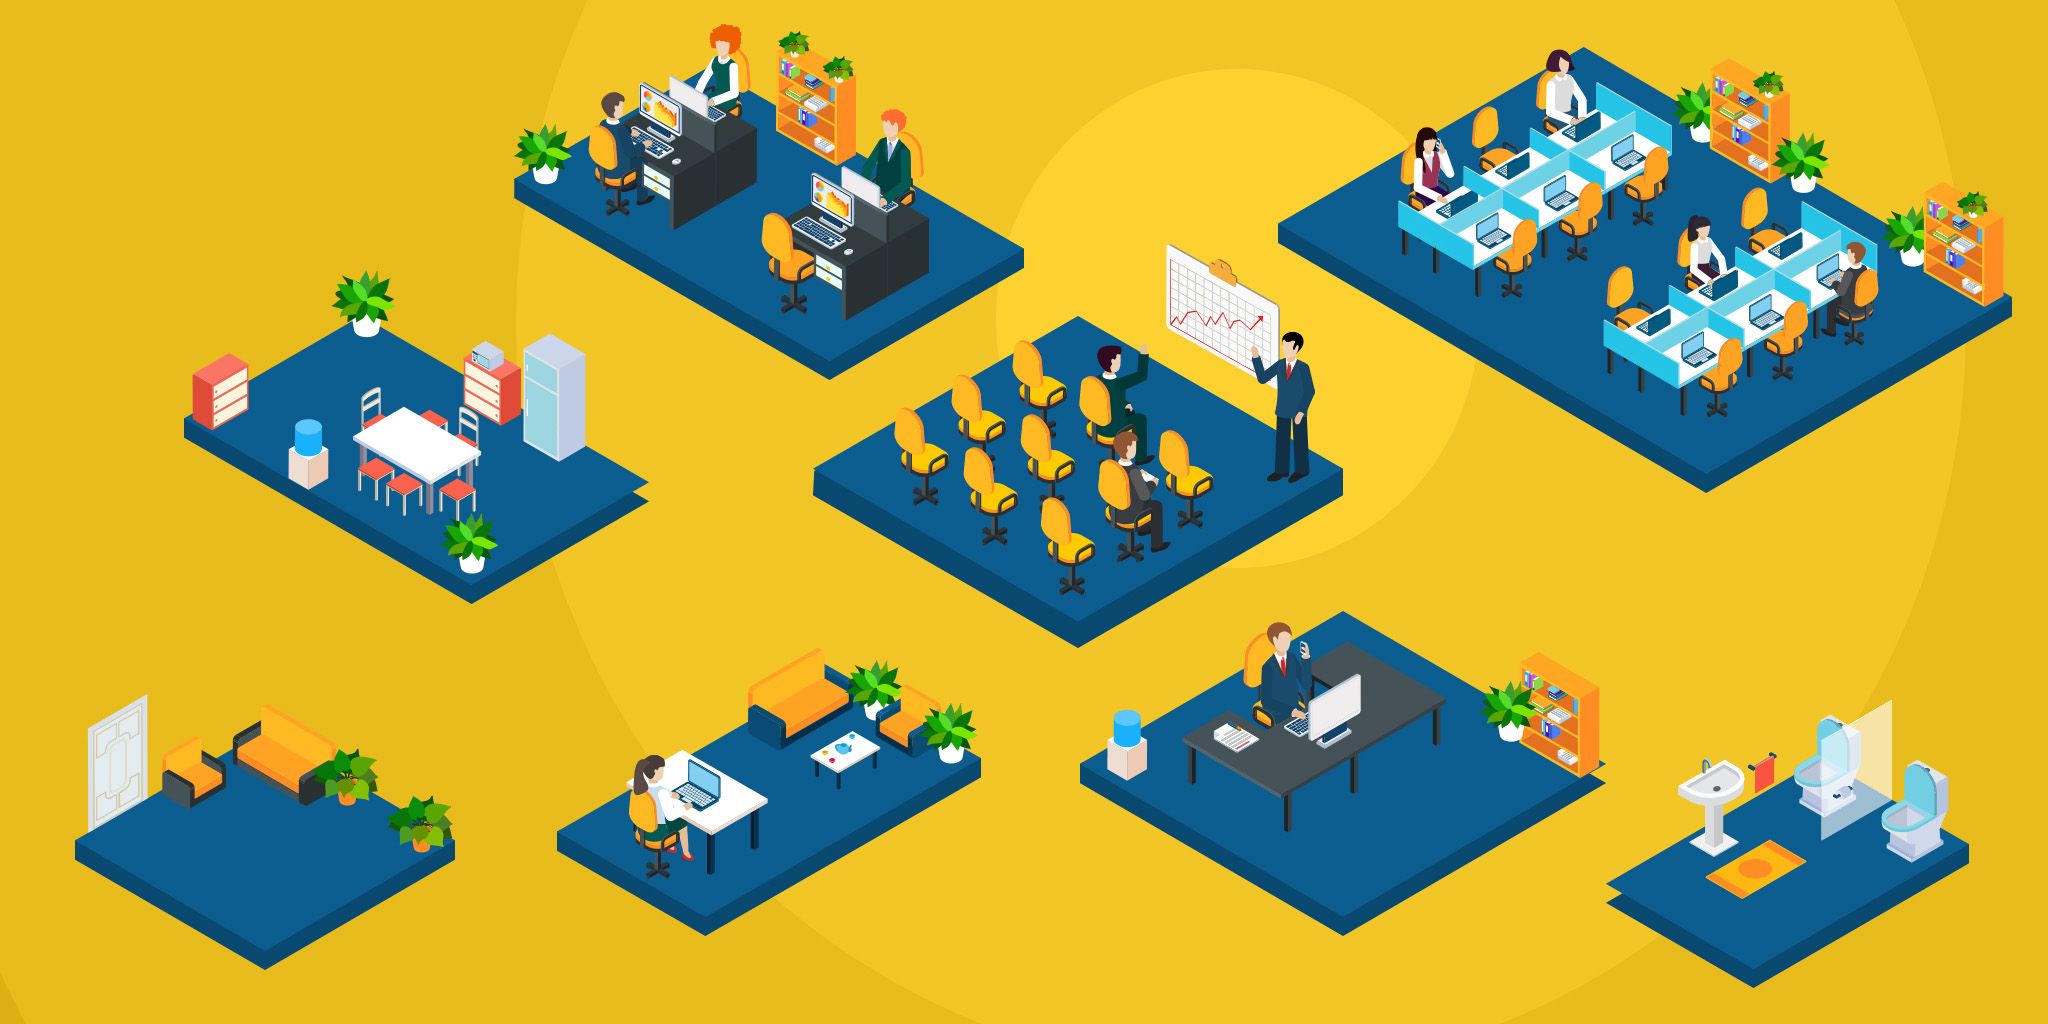
Space Management for Buildings
Monitor occupancy and workspace usage to optimize comfort, efficiency, and revenue potential across commercial buildings.
Monitor occupancy and workspace usage to optimize comfort, efficiency, and revenue potential across commercial buildings.
Milesight
Milesight

Related Solutions
Buildings & Facilities
Child Safety Badges for Large Venues
Smart badges enable instant reunification, proactive alerts, and a safer, more trusted guest experience.
Iveda
Buildings & Facilities
Energy Management for Smart Buildings
Gain visibility, cut energy waste, and enhance comfort with AI‑driven analytics for more sustainable and cost‑effective building operations.
Milesight
Buildings & Facilities
Space Management for Buildings
Monitor occupancy and workspace usage to optimize comfort, efficiency, and revenue potential across commercial buildings.
Milesight