Condition Monitoring via LoRaWAN
Condition Monitoring via LoRaWAN
- Last Updated: December 2, 2024
Guest Writer
- Last Updated: December 2, 2024

LoRaWAN Strengths and Weaknesses
There is now a wide range of different wireless technologies for sensor data transmission and condition monitoring in industrial IoT projects. Some use frequencies that require a license, such as 5G, 4G, LTE-M, or NB-IoT; others share license-free bands in the range of 868 MHz, 2.4, or 5 GHz. These include LoRaWAN, Mioty, and WLAN, as examples. Selecting the optimal wireless technology for specific tasks is a complex task, and it should be done with the involvement of suitable experts when possible.
LoRaWAN can be a good choice when key factors become particularly important. These factors include wide areas of coverage on an operating site with different buildings, low cost of infrastructure and operation, use of an established standard, and a large number of users and providers. However, LoRaWAN is less suitable for transmitting large amounts of data due to the low bandwidth, the associated low data transmission rate, and the duty cycle regulations in the 868 MHz range. For this reason, additional sensors with embedded AI algorithms are required for sophisticated monitoring applications.
LoRaWAN offers wide coverage and low operating costs, at the expense of low bandwidth and slow data transmission rates. Embedded AI algorithms can lower network use while monitoring important status changes.
Classifying Sensor Information
An Excess of Raw Output
Conventional sensors typically take a specific physical value as input at routine intervals and deliver the output (a voltage, resistance, or capacity value for example) within the same interval. Depending on the operating principle of the sensor element and its respective measurement method, relatively large amounts of data can be generated within a short period of time. In the case of a MEMS accelerometer that determines the inertial force acting on a test mass via capacitive changes, this can be several thousand bytes per second depending on the bandwidth and the number of acceleration axes. Even with a simple infrared sensor array with 8x8 pixels for measuring the temperature of surfaces and other objects over a certain distance, a refresh rate of 1 Hz still results in 128 bytes per second.
In many IoT applications, a suitable transmission channel transmits digital sensor output data as an endless data stream to an edge computer system or even the cloud for analysis. The reason for the ubiquity of such sensor-to-edge or sensor-to-cloud configurations is that powerful, easy-to-use software runtime environments already exist for the respective target platforms, and the corresponding sensor data analysis and evaluation solutions have already been implemented. Such solutions are questionable from an efficiency point of view, however: they require considerable network bandwidth and – especially in the case of cloud-based solutions – often also incur relatively high costs. More importantly, some time-critical tasks are not possible at all with centralized sensor data evaluation, for reasons of latency and availability. Autonomous driving is a perfect example of a task where the potential latency between sensor input, analysis, and reaction makes centralized data processing untenable.
From Output to Information: Data Classification
This brings us to the subject of data classification. In the industrial automation environment, i.e. the world of machines and manufacturing plants, there are countless applications that process and convert a sensor's raw data stream into a classification using special data analysis. Condition monitoring is a prime example of the practical use of this classification. It is often used to answer the question of which state a particular machine is in at a given moment (e.g. whether the machine is standing by for instructions, undergoing setup, or actively processing). Another example would be the wear condition of the slip ring components of a drive assembly, assessed by using thermographic images (as shown in Figure 1, there are only two relevant states: OK or critical.)
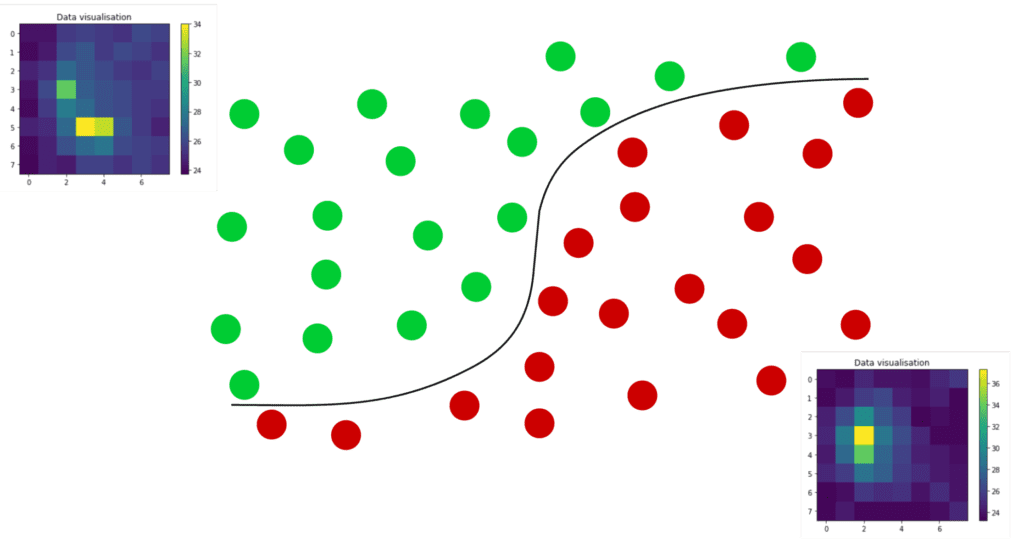
Figure 1: The thermal images of individual machine components are measured once per second with an 8x8 IR sensor array. The respective image data is binary classified (state OK or critical) directly in the sensor using a machine learning model. Each state change is sent to a monitoring system via LoRaWAN. The sensors have a BLE-based service interface via which the respective ML model is loaded into the sensor. (Source: SSV Software Systems GmbH)
Data Analysis at the Sensor
The Traditional Machine Learning Design Pattern
When implemented in the cloud or on-premises servers, traditional ML applications use powerful processors that convert a lot of electrical energy into heat and therefore require special power supplies and ventilation designs. They are relatively sensitive to external disturbances, and should thus only be deployed in specially protected environments. Sensors, on the other hand, use simple microcontrollers with comparatively low computing power and relatively little program and data memory, with minimal power supply needs to match. These are suitable as TinyML runtime environments for condition monitoring under certain conditions.
Embedded Machine Learning and TinyML
With the current state of the industry, the sensor data analysis required for accurate condition classification can also be performed directly at the sensor. The relevant function blocks fall under the umbrella term “TinyML”. TinyML refers to a collection of methods and concepts for machine learning (ML) applications with embedded microcomputer systems. It includes algorithms and other software functions, as well as hardware aspects.
Currently, TinyML is primarily using supervised machine learning. This ML method consists of two steps: model building and model usage. In model building, an ML model is generated based on specifically collected data and the model stored in a file. Artificial neural networks (ANNs) use weighting parameters to “learn” correlations between the acquired data and their classifications. This process is very computationally intensive and should therefore take place in the cloud or on the aforementioned on-premises powerful servers. The resulting model can be targeted to virtually any mathematical regression or classification task on a case-by-case basis. The decisive factor in its effectiveness, however, is the quality of the captured data from which the ANN learns the correlations.
After the model building process is complete, model usage begins. Using TinyML methods, an embedded systems application for data classification can then be created from the model file, which can be executed directly in a sensor. With this application, the sensor's input data can be analyzed periodically. The result of each period of analysis is a regressand (i.e. an output variable dependent on the input data) or a classification (e.g. a specific machine state). This model-based ML analysis process is also called the inference phase.
Challenges Facing the TinyML Model
The key components for reducing the volume of raw sensor data to quantities ideal for LoRaWAN utilization are the machine learning model as well as an inference function. In each case, this requires a qualified dataset in which a learning algorithm reliably finds the desired correlations (for example, thermal images for the OK and critical states). For both the learning process and the following inference phase, some parameters have to be specified, describing the ANN itself and the optimization methodology of the learning process, etc.
The model created after the learning process completes has to be tested with respect to accuracy (the error rate of the inference depends on it). If necessary, the modeling process may be repeated with modified parameters to minimize errors in the inference phase. Once the accuracy is satisfactory, the model is converted into a TinyML format and integrated into the software of the respective sensor to perform the condition monitoring.
To show the interested reader the procedure required for this with an example, IR thermal images will be published on GitHub as sample data plus the necessary Python code for a suitable ML model including a description, which can be created using the open-source library TensorFlow. Special programming skills are not required for this.
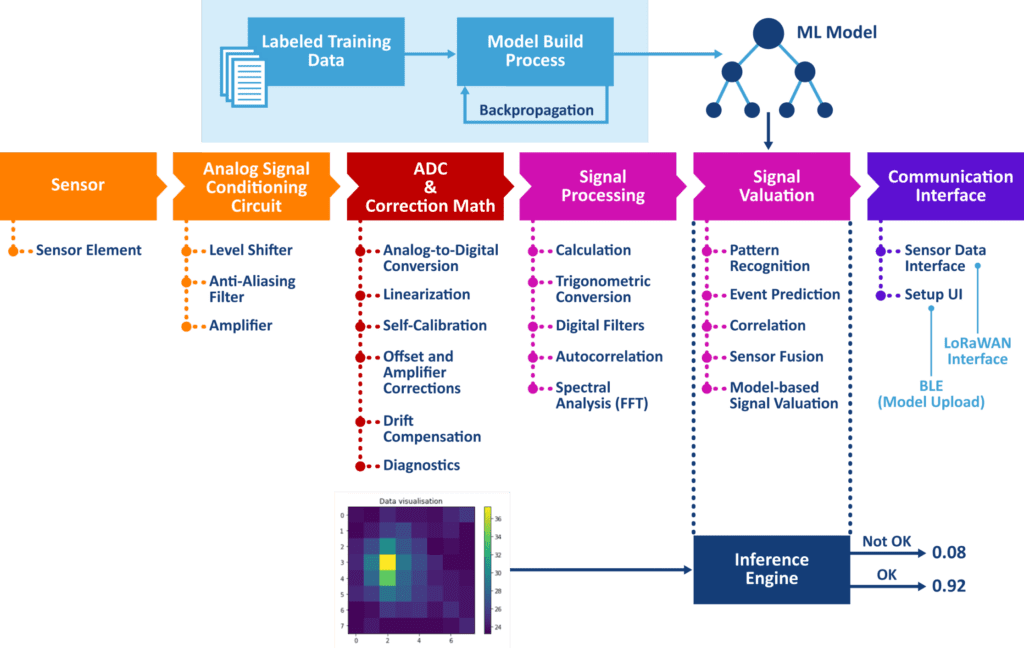
Figure 2: TinyML methods and concepts enable smart LoRaWAN sensors to analyze input metrics using machine learning (ML) models directly within the sensor and provide, for example, a categorical variable at the output. Such a sensor can, for example, monitor the status of a machine or plant or of a resource container and send information over the radio link only in the event of changes. The required ML model is loaded into the sensor via a Bluetooth radio interface during commissioning or maintenance work. (Source: SSV Software Systems GmbH)
The Most Comprehensive IoT Newsletter for Enterprises
Showcasing the highest-quality content, resources, news, and insights from the world of the Internet of Things. Subscribe to remain informed and up-to-date.
New Podcast Episode

IoT Is Finally Delivering
Related Articles

Related Solutions
Smart License Plate Recognition
Automate parking enforcement and access control with real-time vehicle identification to improves revenue collection.
Automate parking enforcement and access control with real-time vehicle identification to improves revenue collection.
Conure
Conure
Sensing-as-a-Service for Grocery Stores
Environmental monitoring, compliance tracking, and real-time alerts to help grocers protect perishable goods and streamline labor.
Environmental monitoring, compliance tracking, and real-time alerts to help grocers protect perishable goods and streamline labor.
SmartSense by Digi
SmartSense by Digi

Air Quality Monitoring for Cities
Empowers governments to improve public health and achieve clean air goals with real‑time, hyperlocal pollution data.
Empowers governments to improve public health and achieve clean air goals with real‑time, hyperlocal pollution data.
SODAQ
SODAQ
Related Solutions
Smart Cities
Smart License Plate Recognition
Automate parking enforcement and access control with real-time vehicle identification to improves revenue collection.
Conure
Retail
Sensing-as-a-Service for Grocery Stores
Environmental monitoring, compliance tracking, and real-time alerts to help grocers protect perishable goods and streamline labor.
SmartSense by Digi
Smart Cities
Air Quality Monitoring for Cities
Empowers governments to improve public health and achieve clean air goals with real‑time, hyperlocal pollution data.
SODAQ