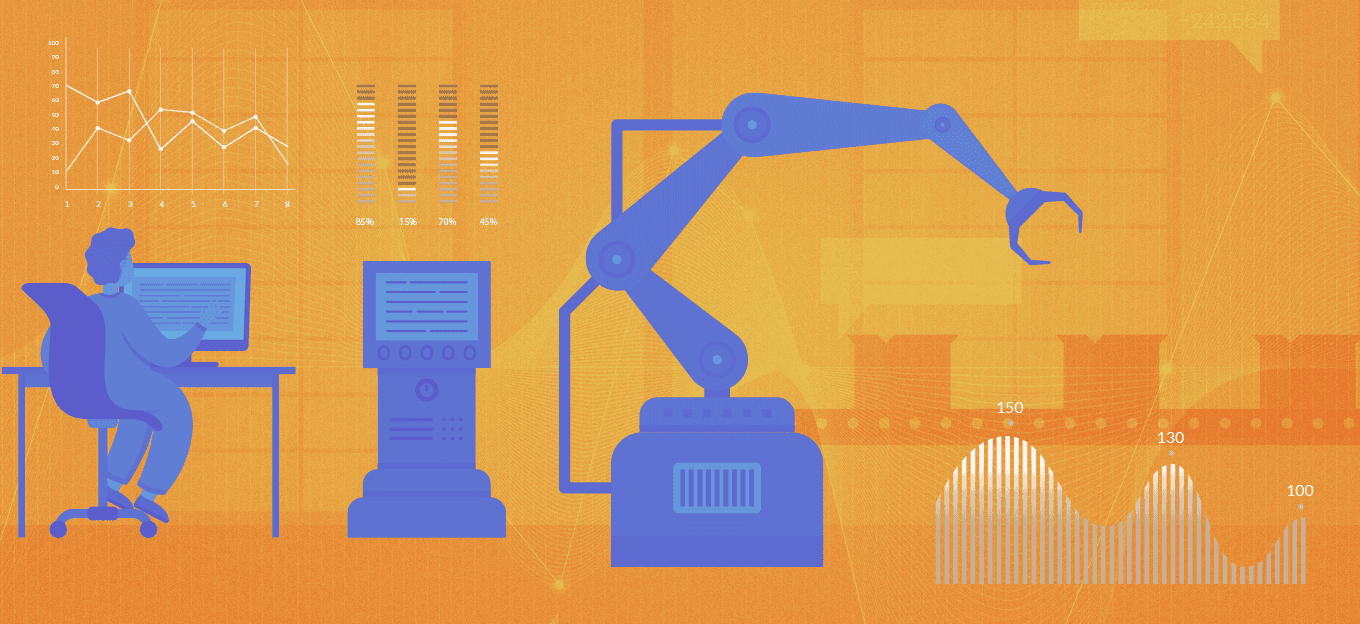
How Factories Use Environmental Sensors to Predict Equipment Failures and Cut Downtime
How Factories Use Environmental Sensors to Predict Equipment Failures and Cut Downtime
- Last Updated: April 10, 2026
Faisal Mahmood
- Last Updated: April 10, 2026
Picture a midnight shift inside an automotive plant. The line is running smoothly, and every station is in sync. Then, without warning, a conveyor locks up. Not a slow stop but a hard seizure. Upstream robots freeze, and downstream operators wait with empty hands. Within minutes, the entire line is disrupted. Every hour lost at this level can cost close to one hundred thousand dollars when you count lost production and recovery effort.
When maintenance finally opens the drive housing, they find a failed bearing. Burnt and seized. What makes it worse is that this did not happen suddenly. The machine had been giving signals for days. The heat was rising slowly. Vibration patterns were shifting. Tiny signs were there, but no one could see them in time.
This is where environmental sensors predict equipment failures before they shut down production. These sensors track what machines experience during operation. Temperature sensors reveal heat buildup. Humidity sensors show moisture risk. PM sensors track dust that causes wear. Vibration sensors measure mechanical stress. Pressure sensors expose leaks and flow changes. Acoustic sensors detect early sound patterns that humans cannot hear.
Each signal alone may look small. When combined, they form a clear picture of machine health. Factories that rely on these signals often reduce unexpected downtime by thirty to fifty percent. They move from reacting to planning.
This article explains how these sensors work in real factory conditions. You will see how they are installed, how data flows through systems, and how teams use them to detect failure early. The focus stays practical and based on what actually works on production floors.
Core Environmental Sensors in Action
Temperature Sensors
Temperature sensors are often the first indicator that something is wrong. Most failures begin with friction or electrical stress, which creates heat.
A healthy bearing usually runs between forty and sixty degrees Celsius. When lubrication weakens or alignment shifts, heat begins to rise. If the temperature crosses eighty degrees and stays there, the risk of failure increases sharply.
The key is not a single reading but a steady trend upward. A gradual rise over several hours or days is a strong signal.
Typical setup
- Installed close to the bearing housing
- Readings every few seconds
- Alert when the temperature rises ten to fifteen percent above normal
Motors follow a similar pattern. Winding insulation degrades faster when the heat stays elevated.
Humidity Sensors
Humidity sensors predictive maintenance becomes important in areas where moisture affects equipment. Electrical cabinets are especially sensitive.
Most industrial environments stay between thirty and sixty percent relative humidity. When humidity rises above eighty percent, condensation can form. This leads to corrosion and electrical faults over time.
Humidity problems often go unnoticed until failures appear. Monitoring humidity variations helps detect risk early.
Typical setup
- Installed inside cabinets and enclosed spaces
- Readings every thirty to sixty seconds
- Alert when humidity stays above eighty percent for several minutes
Tracking humidity prevents slow damage that builds over weeks.
PM Sensors
PM sensors manufacturing environments deal with airborne particles that settle inside machines. Dust enters bearings, clogs filters, and increases wear.
Safe levels often stay below fifty micrograms per cubic meter. When levels rise and stay high, the rate of wear increases.
Dust does not cause immediate failure, but it shortens equipment life.
Typical setup
- Placed near air intakes and dusty operations
- Readings every few seconds
- Alert when levels remain above fifty micrograms for extended periods
When combined with vibration data, PM levels help explain why wear is increasing.
Vibration Sensors
Factory vibration sensors give direct insight into mechanical conditions. Every machine produces vibration during operation. Changes in that pattern reveal faults.
Healthy machines usually stay below two g RMS. When levels approach five g RMS, the system is under stress. More important is the frequency pattern.
Different faults produce different frequencies. Bearing defects, misalignment, and imbalance each have a unique signature.
Typical setup
- Mounted firmly on machine surfaces
- Sampling at one kilohertz or higher
- Frequency analysis used to detect changes
- Alert when patterns deviate from baseline
Vibration often shows the earliest signs of mechanical failure.
Pressure Sensors
IoT pressure sensors' downtime reduction depends on stable system pressure. Hydraulic and pneumatic systems rely on consistent values.
If a system runs at two hundred psi, it should remain stable. A steady drop of five percent per hour indicates a leak or failing component.
Pressure changes are usually gradual, which makes them easier to track.
Typical setup
- Installed before and after key components
- Readings every few seconds
- Alert when pressure drops consistently over time
Combining pressure with flow data improves accuracy.
Acoustic Sensors
Acoustic sensors detect high-frequency sounds that humans cannot hear. Early faults often produce ultrasonic signals.
Cavitation in pumps and small cracks in materials create sound above forty kilohertz. These signals appear before vibration changes become obvious.
Typical setup
- Installed near pumps and rotating equipment
- Continuous monitoring
- Alert when sound patterns change from normal
Acoustic sensing is useful when other signals are weak or delayed.
Data Pipelines and Processing
Sensor data must be processed correctly to become useful. Raw signals alone do not prevent failure.
Data collection starts at the sensor level. Vibration sensors capture high-speed data often at one kilohertz or more. Temperature and humidity sensors update more slowly.
At the edge, data is filtered to remove noise. Small vibration signals below point one g are often ignored. This reduces unnecessary data flow.
Transmission uses lightweight protocols such as MQTT. Networks like LoRaWAN support communication across large facilities.
Once data reaches central systems, it is combined. This is where multiple signals work together. A vibration change alone may not trigger action. When combined with rising temperatures, it becomes meaningful.
Machine learning models track trends over time. They compare current behavior with historical baselines. Most systems require about thirty days of normal data to establish this baseline.
The remaining useful life is estimated using trend analysis. If vibration and temperature both increase steadily, the system predicts how long the equipment can run safely.
Operators receive alerts with clear time windows. Urgent issues may show warnings within twenty-four to seventy-two hours. Longer trends help plan maintenance days.
The goal is not perfect prediction but enough accuracy to act early.
Real-World Factory Implementations
In an automotive plant, vibration and temperature sensors were added to conveyor motors. Early results showed many false alerts. After three months of baseline tuning, the system became stable. Failures that once appeared suddenly were now detected two days in advance.
A pharmaceutical facility focused on humidity control. Electrical faults were occurring without a clear cause. Sensors revealed high moisture levels inside cabinets. After improving airflow and sealing enclosures, failure rates dropped by more than thirty percent.
In a food processing plant, particulate sensors were combined with vibration monitoring on mixers. Dust buildup increased wear, which appeared in vibration data. By controlling dust levels, mixer downtime dropped by forty-five percent. The investment paid back within a few months.
An oil facility used pressure and acoustic sensors on pumps. Cavitation was detected early through ultrasonic signals. Pressure trends confirmed flow issues. Maintenance teams intervened before major damage occurred.
These examples show a common pattern. Systems improve over time as data grows and thresholds are refined.
Best Practices for Deployment
- Start with critical equipment that has a high impact on production
- Match sensor type with known failure modes
- Integrate data into existing control systems using standard protocols
- Train teams to understand trends and not just alarms
- Keep systems secure with controlled data flow
- Calibrate sensors every three months to maintain accuracy
Future Trends
Sensor networks are becoming denser across production lines. Instead of a few points, machines now have many sensors capturing detailed data. Edge processing is improving, which allows faster decisions without relying on central systems.
Digital twins are gaining use in factories. These models replay past sensor data and simulate machine behavior under different conditions. Prediction accuracy improves as systems gather more data. After extended use, many systems reach accuracy levels above ninety-five percent.
Equipment failure rarely happens without warning. The challenge is seeing those signals early enough to act. Environmental sensors make these signals visible. They turn small changes into clear insights that teams can use.
Starting with one production line is often the best approach. Build a baseline, understand normal behavior, and expand from there. When environmental sensors predict equipment failures, the result is fewer surprises and more control over operations.
The Most Comprehensive IoT Newsletter for Enterprises
Showcasing the highest-quality content, resources, news, and insights from the world of the Internet of Things. Subscribe to remain informed and up-to-date.
New Podcast Episode

IoT Is Finally Delivering
Related Articles


Related Solutions

Remote Propane Tank Monitoring
Retrofit LoRaWAN® sensor to provide accurate, real-time fuel level readings from R3D-compatible gauges.
Retrofit LoRaWAN® sensor to provide accurate, real-time fuel level readings from R3D-compatible gauges.
EAMS Technologies
EAMS Technologies

Condition Monitoring and Analytics for Industrial Systems
Monitor, maintain, and automate distributed industrial systems using customizable edge-to-cloud intelligence.
Monitor, maintain, and automate distributed industrial systems using customizable edge-to-cloud intelligence.
Pratexo
Pratexo

Predictive Infrastructure Monitoring for Facilities
AI-enabled monitoring platform for complex technical environments. Predict equipment failures, optimize energy, and unify monitoring.
AI-enabled monitoring platform for complex technical environments. Predict equipment failures, optimize energy, and unify monitoring.
Skysens
Skysens
Related Solutions
Industrial
Remote Propane Tank Monitoring
Retrofit LoRaWAN® sensor to provide accurate, real-time fuel level readings from R3D-compatible gauges.
EAMS Technologies
Industrial
Condition Monitoring and Analytics for Industrial Systems
Monitor, maintain, and automate distributed industrial systems using customizable edge-to-cloud intelligence.
Pratexo
Buildings & Facilities
Predictive Infrastructure Monitoring for Facilities
AI-enabled monitoring platform for complex technical environments. Predict equipment failures, optimize energy, and unify monitoring.
Skysens