Lights Out and Away We Go: Formula 1 and AWS Team Up to Race
Lights Out and Away We Go: Formula 1 and AWS Team Up to Race
- Last Updated: December 2, 2024
Lauren Winkler
- Last Updated: December 2, 2024

The 2021 Formula 1 season had an exciting start last month in Bahrain with the fastest cars in the world speeding around the track and Lewis Hamilton taking home his 166th podium win. If you are new to the sport, Formula 1 (F1) is the highest class of international auto racing for single-seater racing cars. Ten teams compete each year to build the fastest cars they can put on the track. And this year, Formula 1 and AWS are making sure IoT is playing an ever larger role in securing victory.
The difference between winning and losing in Formula 1 is milliseconds, and getting information from the car to the team and driver is key to getting on the podium.
Why Data is Important
The Practice Sessions
A Formula 1 car is changing throughout each three-day Grand Prix event, informed by the data collected from sensors on the car. The cars are constructed in such a way that each piece can be updated, removed, replaced and fine-tuned to meet the needs of the moment. Each weekend has three practice sessions that are used for teams and drivers to test their cars on the unique tracks. The numerous points of data help engineers and designers modify the cars — built in design offices and tested in wind tunnels — to get the most performance possible on the track.
The Race
The difference between winning and losing in Formula 1 is milliseconds, and getting information from the car to the team and driver is key to getting on the podium. In an F1 car there are hundreds of sensors that relay information back to the racing team. They get insight into all aspects of the car from how hot the brakes are, to the wear on the tires, to the fluid levels throughout the car. Data scientists and strategists sit on the pit wall and use the data to make real-time calls and give advice to the racing engineers. With this information, teams tweak the cars remotely to get the most out of the car. The smallest adjustment can be the make or break of getting to that checkered flag, which makes F1 a truly data-driven sport, and it has been since 1997, when the sport began using connected cars to capture racing data.
Formula 1 and AWS, with the Fédération Internationale de l'Automobile (FIA), which runs Formula racing, are working together to collect data and perform analysis for F1. Each car incorporates more than 300 sensors that can generate more than 1.1 million data points per second to be transmitted from the cars to the pit. In addition, there are numerous points of data collection around the track that report everything from weather conditions to pit crew diagnostics.
Fans Get Inside the Action
Fans who are interested in the nitty gritty data now get an insider’s visibility into how their favorite driver snags a spot on the podium. The data behind gear, speed, throttle and braking throughout the race give the F1 fanatic a deeper viewpoint into the fast-paced sport.
Formula 1 and AWS Insights
Throughout the past few years there has been a growing interest in telling the story of live F1 racing by sharing telemetry data with the fans that drive the sport. F1 Insights powered by AWS is designed to add real-time context to the race data by displaying live data analytics through on-screen graphics. Access to live data gives fans a deeper appreciation of the driver and team decisions during key moments on the track.
This year, Formula 1 and AWS have announced six new F1 Insights Powered by AWS graphics set to debut during the 2021 F1 season. The first of these new graphics will be concentrated on Braking Performance and is due to appear on screens at this weekend's Emilia Romagna Grand Prix in Italy.
The other 5 graphics set to debut in 2021 are:
- Car Exploitation: by comparing a car’s current performance in real-time against its theoretical performance limit, and calculating the relative time gained or lost per lap, this graphic will reveal when F1 drivers are pushing their cars to the limit in areas like tire traction, braking, acceleration and maneuvering.
- Energy Usage: this graphic will provide insights into how the cars’ power units are using energy throughout the race, including when teams unleash extra electrical energy to allow their driver to attempt an overtake on a rival, as well as how much battery energy is left at any given moment.
- Start Analysis: will show which drivers had the best reaction when the five lights went out and racing got under way.
- Pitlane Performance: analyze the teams’ pit stops, highlighting total pitlane time lost or gained due to how efficiently the team and driver work.
- Undercut Threat: will help fans anticipate which cars are at risk of being overtaken as the result of an ‘undercut’ – where a driver pits earlier than the rival ahead of them, before attempting to use the extra speed from their fresh rubber to move ahead of the rival after they’ve pitted. The Undercut Threat graphic will show the gaps between the cars, as well as the average pit stop loss time and tire performance to help identify cars that are at risk of being undercut.
By the end of this 2021 season there will be 18 AWS-powered stats available to fans.
Vroom, vroom.
The Most Comprehensive IoT Newsletter for Enterprises
Showcasing the highest-quality content, resources, news, and insights from the world of the Internet of Things. Subscribe to remain informed and up-to-date.
New Podcast Episode

IoT Is Finally Delivering
Related Articles

Related Solutions
Trolleys and Dollies Tracking for Airports
Track the location and utilization of airport ground support equipment to reduce idle time and improve efficiency.
Track the location and utilization of airport ground support equipment to reduce idle time and improve efficiency.
SODAQ
SODAQ
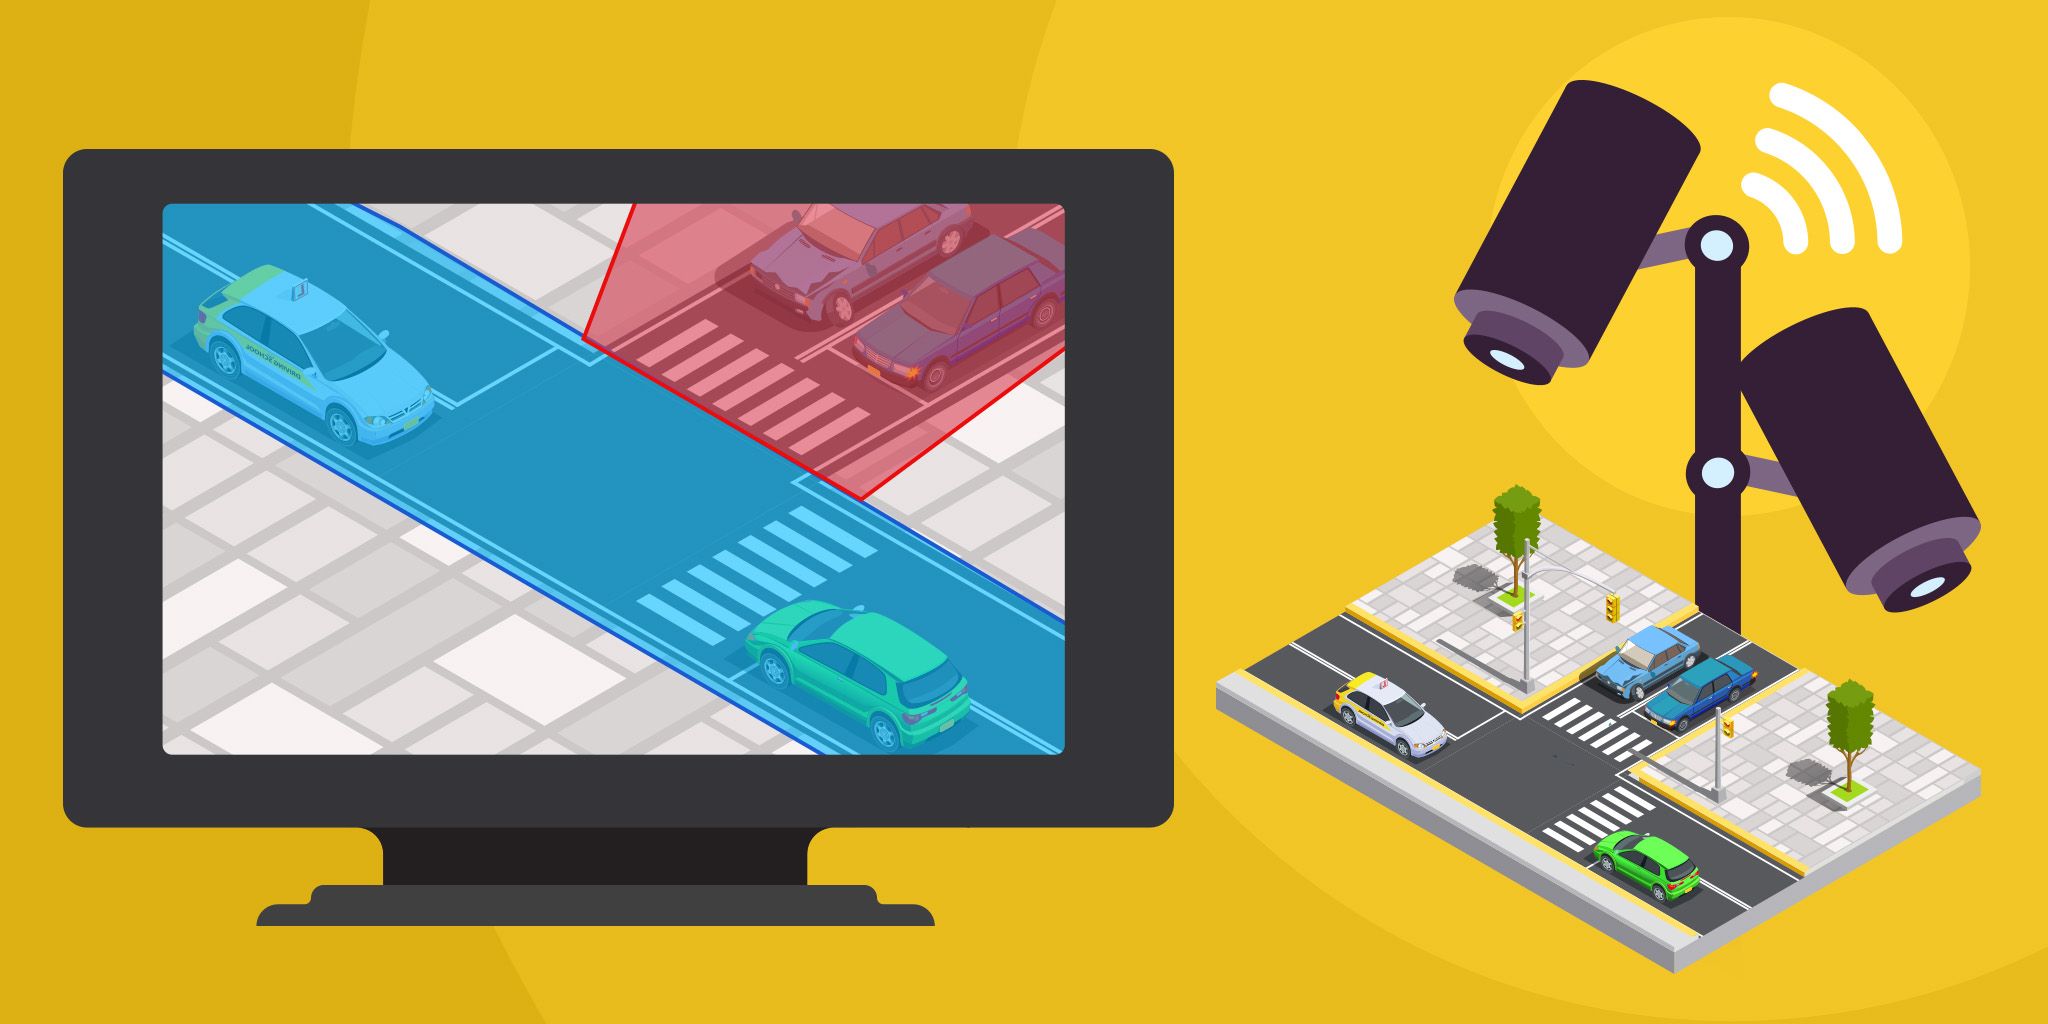
Traffic Optimization for Cities
Turn existing city cameras into AI‑powered intersection monitors that deliver real‑time vehicle counts, speed tracking, and violation detection.
Turn existing city cameras into AI‑powered intersection monitors that deliver real‑time vehicle counts, speed tracking, and violation detection.
Iveda
Iveda

Emergency Department Workflow Management
Gain a complete view of patient flow, staff activity, and resource availability to reduce wait times, improve satisfaction, and optimize throughput.
Gain a complete view of patient flow, staff activity, and resource availability to reduce wait times, improve satisfaction, and optimize throughput.
Vizzia Technologies
Vizzia Technologies
Related Solutions
Supply Chain & Logistics
Trolleys and Dollies Tracking for Airports
Track the location and utilization of airport ground support equipment to reduce idle time and improve efficiency.
SODAQ
Smart Cities
Traffic Optimization for Cities
Turn existing city cameras into AI‑powered intersection monitors that deliver real‑time vehicle counts, speed tracking, and violation detection.
Iveda
Healthcare
Emergency Department Workflow Management
Gain a complete view of patient flow, staff activity, and resource availability to reduce wait times, improve satisfaction, and optimize throughput.
Vizzia Technologies