Predictive Maintenance Without Alert Fatigue - How Complexity Theory Changes the Game
Predictive Maintenance Without Alert Fatigue - How Complexity Theory Changes the Game
- Last Updated: March 2, 2026
ALEC Codec
- Last Updated: March 2, 2026
Industrial equipment doesn't fail randomly. A bearing doesn't suddenly seize. A pump doesn't unexpectedly cavitate. These failures follow patterns—patterns that traditional monitoring systems consistently miss.
Yet most condition monitoring systems only detect problems when it's already too late: when vibration exceeds threshold, when temperature crosses the limit, when pressure drops below acceptable levels. By then, the damage is done.
Why Static Thresholds Fail
Here's the fundamental problem with threshold-based alerting: it monitors symptoms rather than causes.
Consider a typical industrial pump. Traditional monitoring watches individual parameters, including vibration amplitude, motor temperature, discharge pressure, and power consumption. Each parameter has a threshold. Cross it, trigger an alert. Simple, right?
But equipment degradation doesn't work that way. A failing bearing doesn't announce itself with a single parameter spike. Instead, the relationship between parameters changes. Vibration might increase slightly while temperature rises marginally—both well within normal ranges. But the correlation between them shifts from 0.8 to 0.3.
That correlation change is your early warning. Static thresholds miss it entirely.
The result? Alert fatigue. A typical industrial facility generates hundreds of alerts daily. Teams become desensitized. Critical warnings get lost in the noise. And failures that could have been predicted weeks in advance become expensive emergency repairs.
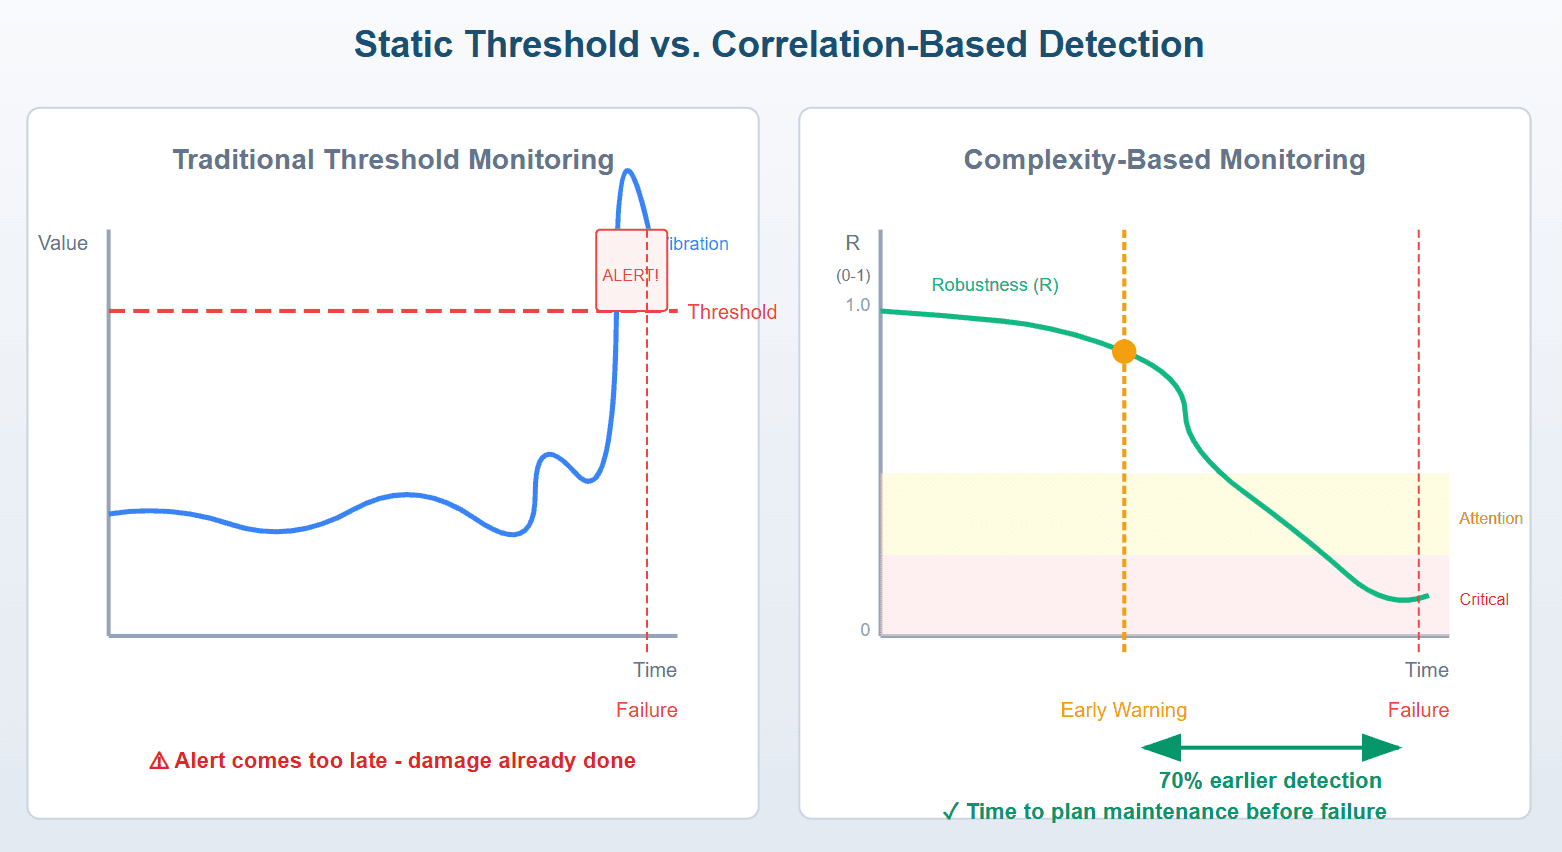
Static Threshold vs. Correlation-Based Detection
The Complexity Approach: Monitoring Relationships, Not Just Values
What if, instead of monitoring individual parameters, we monitored the structure of how parameters relate to each other?
This is where Quantitative Complexity Theory (QCT) enters the picture—a mathematical framework developed over two decades with applications in finance, medicine, and now industrial IoT.
The core insight: healthy systems have predictable correlation structures. When equipment operates normally, temperature and vibration correlate in consistent ways. Load and power consumption follow expected patterns. These relationships form a "complexity signature" unique to each machine.
Degradation disrupts these relationships before individual values exceed thresholds.
Three Metrics That Matter
- 1. Entropy (H) — How much disorder exists in each sensor's data stream. Sudden entropy spikes indicate erratic behavior—even when average values look normal.
- 2. Complexity (C) — The correlation structure between all sensors. Healthy equipment maintains stable inter-sensor relationships. When C changes significantly, something in the system's behavior has shifted.
- 3. Robustness (R) — A single 0-1 score representing system health. R combines entropy and complexity into an actionable metric: above 0.5 is healthy, 0.2-0.5 requires attention, and below 0.2 is critical.
The key advantage: R typically drops 70 percent earlier than traditional threshold alert triggers.
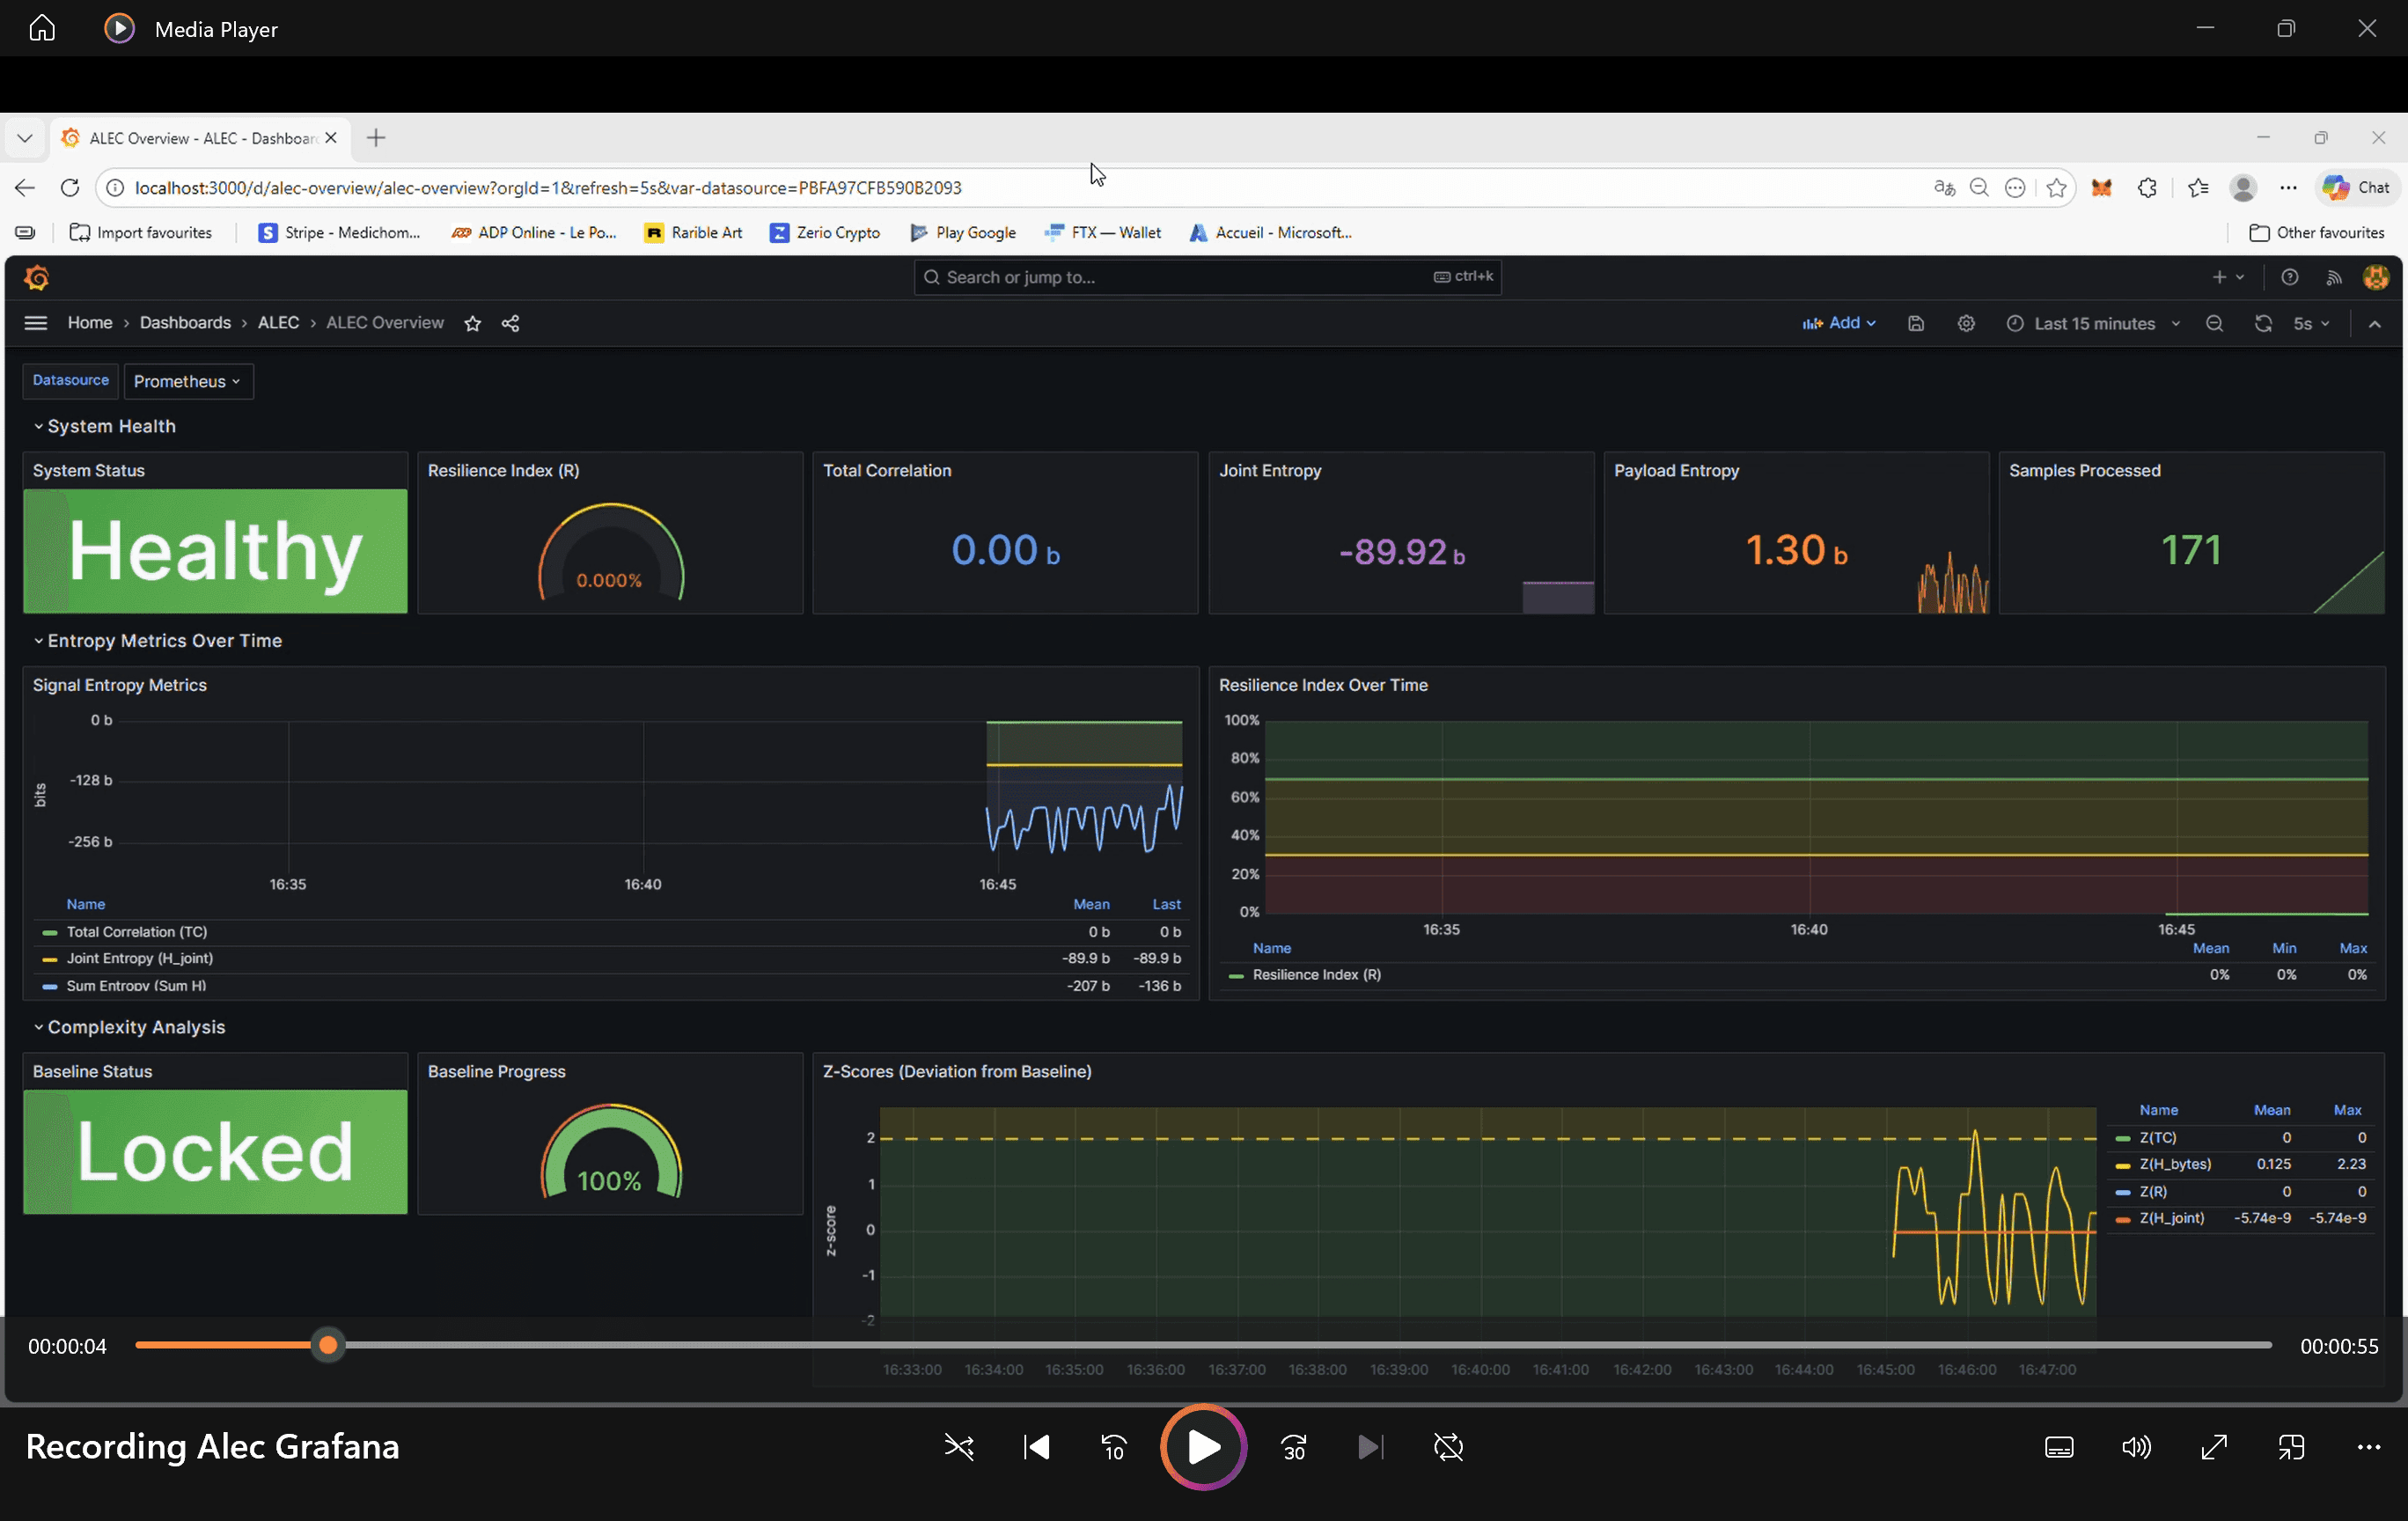
H, C, R Metrics Dashboard Example
From Theory to Practice: Implementation Challenges
The concept is compelling. Implementation is harder. Industrial environments present unique challenges:
- Data Volume: A single production line might have 50+ sensors generating readings every second. That's 4.3 million data points daily—per line.
- Bandwidth Constraints: Many industrial sensors use LoRaWAN, cellular, or satellite connectivity, where every byte costs money and drains batteries.
- Edge Computing Limits: Embedded sensors have kilobytes of RAM, not gigabytes. Complex algorithms must run on constrained hardware.
- Integration Complexity: Data lives in PLCs, SCADA systems, historians, and cloud platforms. Correlation analysis requires unified access.
A Three-Layer Architecture for Complexity-Based Monitoring
Layer 1: Efficient Data Transmission
Before you can analyze correlations, you need data—lots of it. But transmitting raw sensor streams is prohibitively expensive on constrained networks.
Traditional compression (gzip, zstd) fails for IoT streaming. These algorithms need large blocks of data to find patterns. Compress a 24-byte sensor message with gzip, and it actually grows.
IoT-specific compression solves this. Adaptive codecs that learn sensor-specific patterns can achieve 80-95 percent compression on streaming data. A temperature sensor that typically reads 22.3°C doesn't need to transmit "22.3" every time—it transmits the delta from the expected value, often requiring just 2-3 bits.
The impact is dramatic: battery life extends from months to years, transmission costs drop significantly, and higher sampling rates become economically viable. More data, delivered efficiently, enables better correlation analysis downstream.
Layer 2: Multi-Source Correlation
Raw sensor data is useless without context. A vibration reading means nothing until correlated with load, temperature, speed, and power consumption.
A gateway layer aggregates data from heterogeneous sources—Modbus RTU, OPC-UA, MQTT, REST APIs—and computes real-time Pearson correlations between all parameter pairs.
This correlation matrix becomes the foundation for complexity analysis. When historically correlated parameters decorrelate (or vice versa), the system flags the change—regardless of whether individual values crossed any threshold.
Layer 3: Complexity Analysis and Health Scoring
The final layer applies Shannon entropy calculations and complexity metrics to generate the Robustness score (R).
The algorithm maintains a sliding window of recent readings, calculates per-sensor entropy, computes the correlation matrix, derives complexity from correlation structure, learns baseline complexity during initial operation, and calculates R as distance from critical complexity threshold.
When R drops, maintenance teams investigate—before alarms trigger, before failures occur.
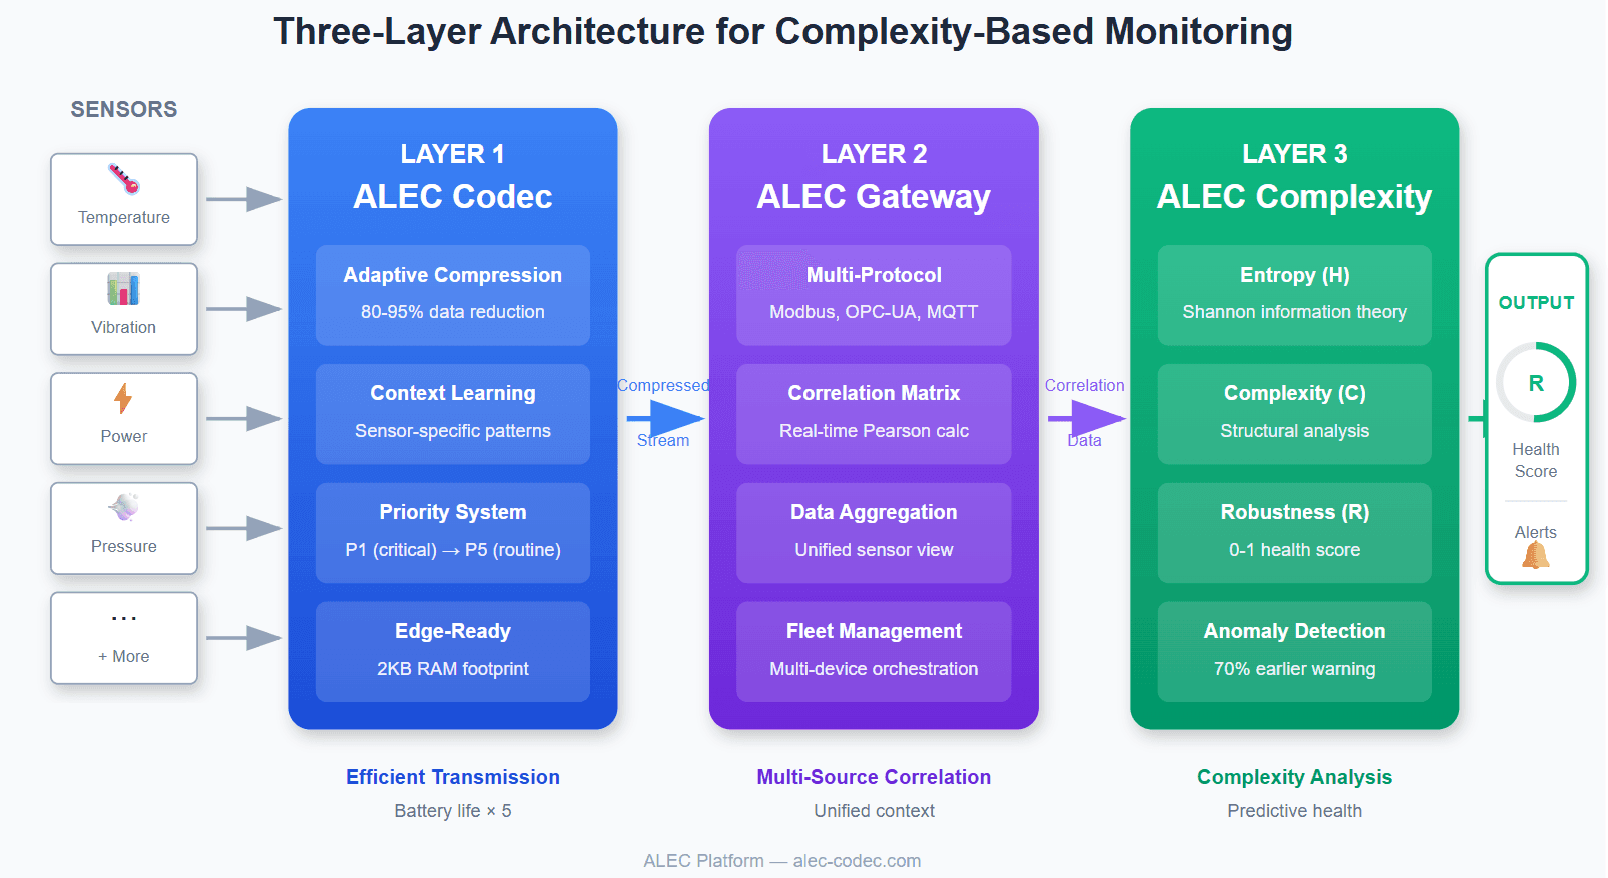
Three-Layer Architecture - Codec → Gateway → Complexity
Real-World Results
This approach has demonstrated measurable impact across industries:
- Pump Stations: Bearing degradation detected 3 weeks before failure
- Production Lines: Quality drift identified 70 percent earlier than SPC limits; scrap reduced by 35 percent
- Power Grid: Transformer anomalies detected before temperature alarms
- IT Infrastructure: Memory leaks detected 4 hours before crashes; alerts reduced from 500+/day to ~20
The common thread: complexity-based monitoring catches the pattern changes that precede failures, not just the failures themselves.
Getting Started: A Practical Path
Implementing complexity-based monitoring doesn't require replacing existing infrastructure:
- Phase 1: Identify Critical Assets — Start with equipment where unplanned downtime is most expensive.
- Phase 2: Ensure Data Availability — Can you access all relevant sensor streams with sufficient sampling rate?
- Phase 3: Establish Baselines — Run in observation mode for 2-4 weeks. Let the system learn normal patterns.
- Phase 4: Validate Against History — Review past incidents. Would complexity metrics have provided an earlier warning?
- Phase 5: Integrate — Connect to existing alerting systems. The goal is augmentation, not replacement.
The Future: From Reactive to Predictive
The shift from threshold-based to complexity-based monitoring represents a fundamental change in how we think about equipment health.
Traditional monitoring asks: "Has this value exceeded its limit?"
Complexity monitoring asks: "Has this system's behavior changed?"
The second question catches problems earlier, reduces alert noise, and transforms maintenance from reactive firefighting to planned optimization.
The only question remaining: how much longer will you wait for threshold alerts to tell you what complexity analysis could have predicted weeks ago?
David Martin is the founder of ALEC Platform, a Swiss company developing IoT compression and complexity-based anomaly detection solutions. ALEC Platform implements the three-layer architecture described in this article through ALEC Codec, ALEC Gateway, and ALEC Complexity.
The Most Comprehensive IoT Newsletter for Enterprises
Showcasing the highest-quality content, resources, news, and insights from the world of the Internet of Things. Subscribe to remain informed and up-to-date.
New Podcast Episode

IoT Is Finally Delivering
Related Articles


Related Solutions
Smart Facility Management
Real‑time data and intelligent automation for efficient and sustainable building operations. Reduce risk, improve occupant comfort, and ensure optimal performance.
Real‑time data and intelligent automation for efficient and sustainable building operations. Reduce risk, improve occupant comfort, and ensure optimal performance.
Milesight
Milesight

Asset Performance Management for Manufacturers
Monitor, manage, and optimize your equipment with real‑time health checks, predictive maintenance, and lifecycle tracking.
Monitor, manage, and optimize your equipment with real‑time health checks, predictive maintenance, and lifecycle tracking.
IoT83
IoT83

Pump and Motor Monitoring and Intelligence
Discover time-to-failure insights, track degradation, and prevent downtime with real-time monitoring and predictive AI.
Discover time-to-failure insights, track degradation, and prevent downtime with real-time monitoring and predictive AI.
VROC
VROC
Related Solutions
Buildings & Facilities
Smart Facility Management
Real‑time data and intelligent automation for efficient and sustainable building operations. Reduce risk, improve occupant comfort, and ensure optimal performance.
Milesight
Manufacturing
Asset Performance Management for Manufacturers
Monitor, manage, and optimize your equipment with real‑time health checks, predictive maintenance, and lifecycle tracking.
IoT83
Industrial
Pump and Motor Monitoring and Intelligence
Discover time-to-failure insights, track degradation, and prevent downtime with real-time monitoring and predictive AI.
VROC